 4
4peptides
spectra
0.000 | 0.000
0.474 | 0.606
0.000 | 0.000
0.000 | 0.000
0.000 | 0.000
0.382 | 0.512
0.000 | 0.000
0.000 | 0.000
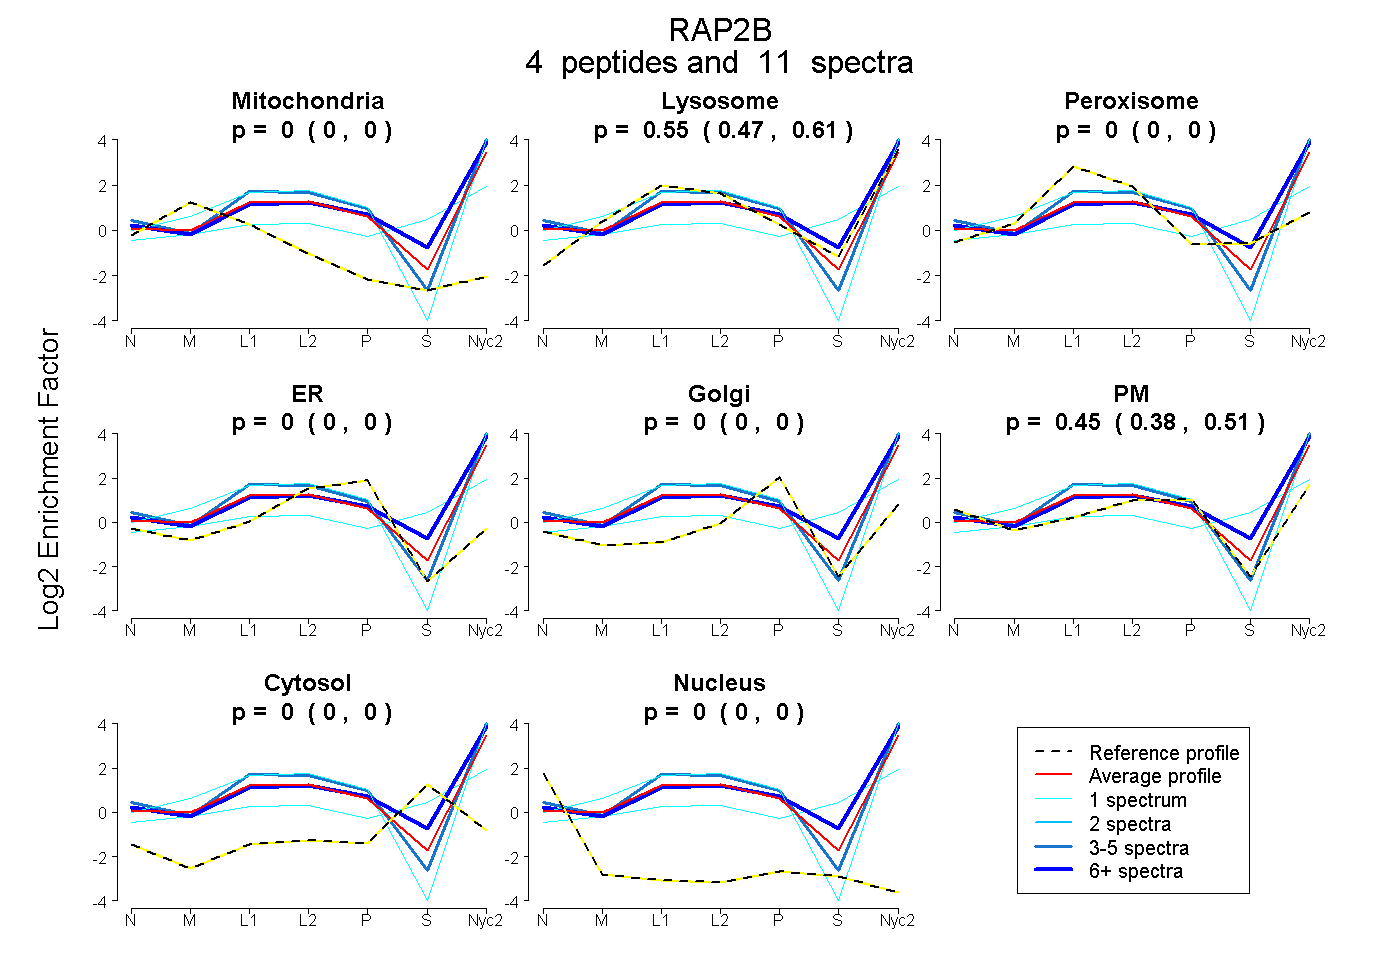
| Plot | Mito | Lyso | Perox | ER | Golgi | PM | Cytosol | Nucleus | |||||
| Expt A |
4 peptides |
11 spectra |
|
0.000 0.000 | 0.000 |
0.547 0.474 | 0.606 |
0.000 0.000 | 0.000 |
0.000 0.000 | 0.000 |
0.000 0.000 | 0.000 |
0.453 0.382 | 0.512 |
0.000 0.000 | 0.000 |
0.000 0.000 | 0.000 |
| 6 spectra, VDLEGER | 0.000 | 0.643 | 0.000 | 0.000 | 0.000 | 0.357 | 0.000 | 0.000 | ||
| 3 spectra, ASVDELFAEIVR | 0.000 | 0.530 | 0.000 | 0.000 | 0.000 | 0.470 | 0.000 | 0.000 | ||
| 1 spectrum, VPMILVGNK | 0.000 | 0.512 | 0.000 | 0.000 | 0.000 | 0.488 | 0.000 | 0.000 | ||
| 1 spectrum, ALAEEWSCPFMETSAK | 0.000 | 0.486 | 0.018 | 0.000 | 0.000 | 0.113 | 0.383 | 0.000 |
| Plot | Mito | Lyso or Perox | ER | Golgi | PM | Cytosol | Nucleus | ||||||
| Expt B |
3 peptides |
3 spectra |
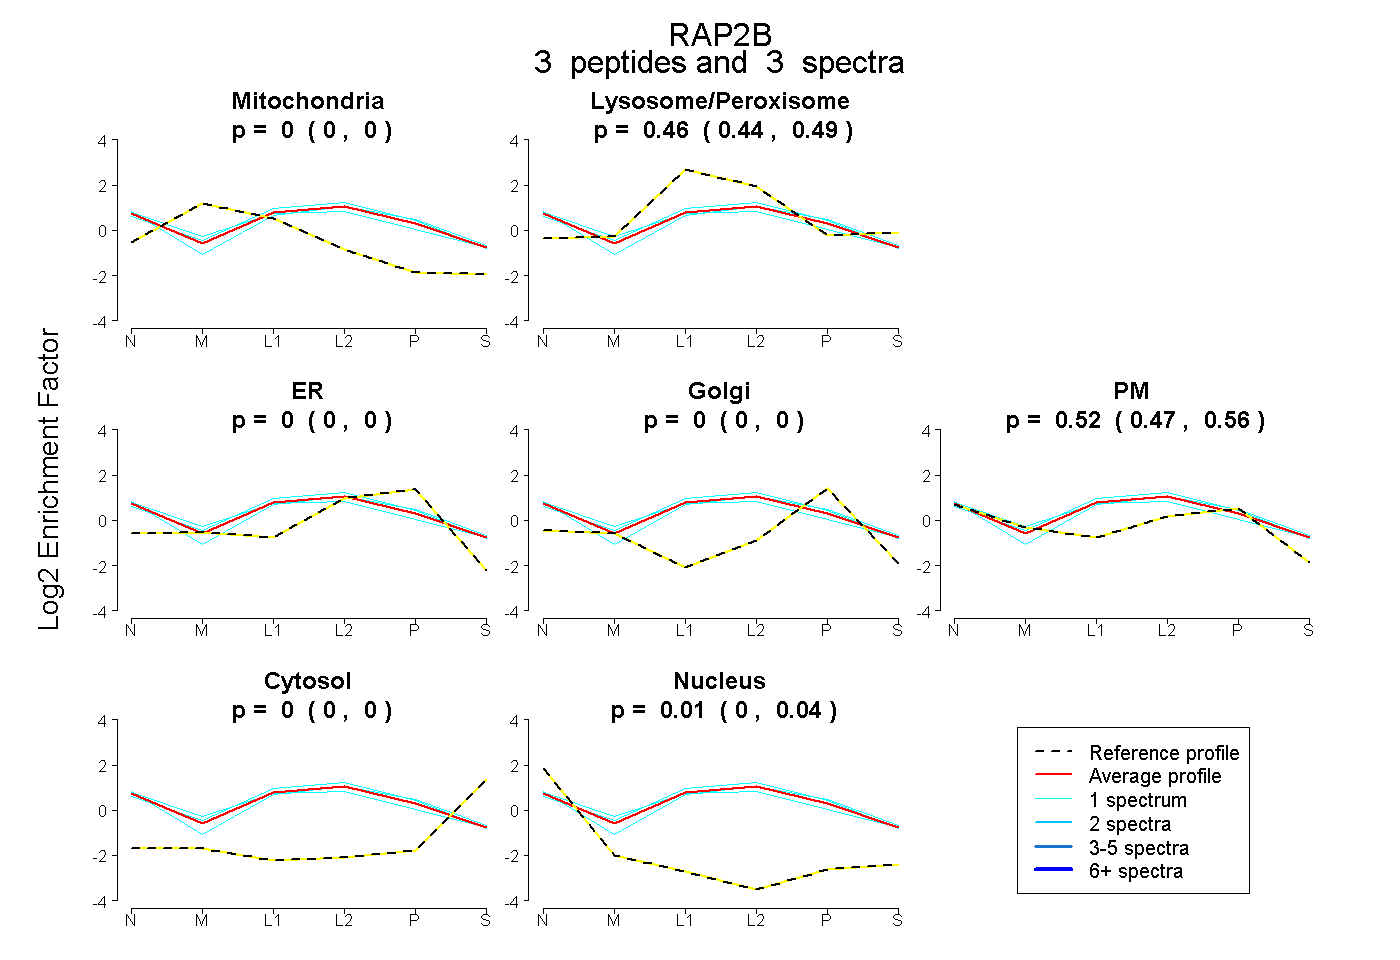 |
0.000 0.000 | 0.000 |
0.465 0.439 | 0.488 |
0.000 0.000 | 0.000 |
0.000 0.000 | 0.000 |
0.521 0.465 | 0.555 |
0.000 0.000 | 0.000 |
0.014 0.000 | 0.042 |
|||
| Plot | Lyso | Other | |||||||||||
| Expt C |
6 peptides |
45 spectra |
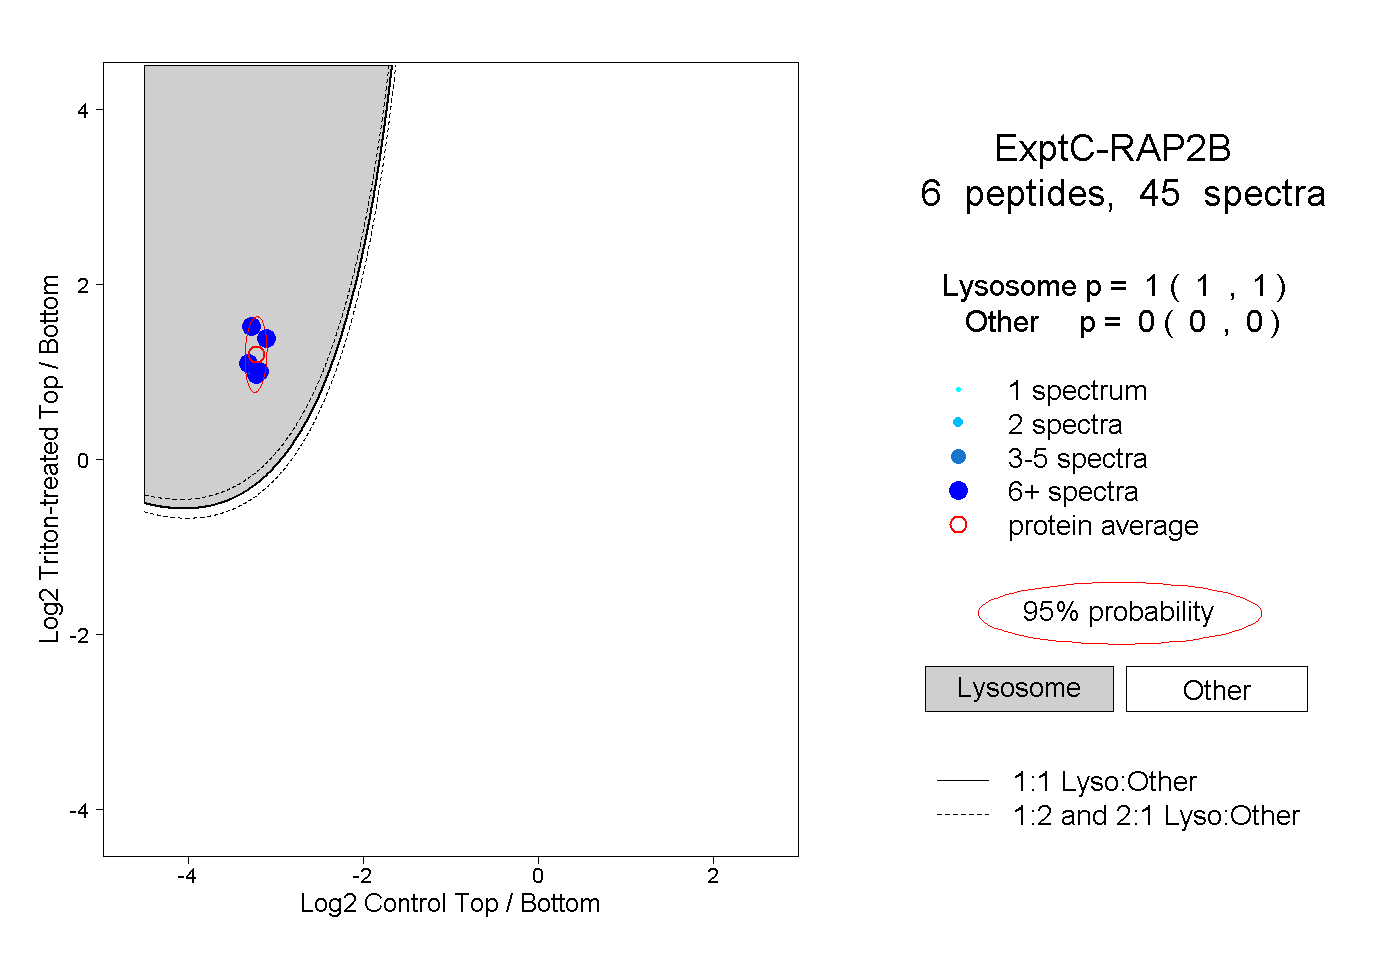 |
1.000 1.000 | 1.000 |
0.000 0.000 | 0.000 |