 3
3peptides
spectra
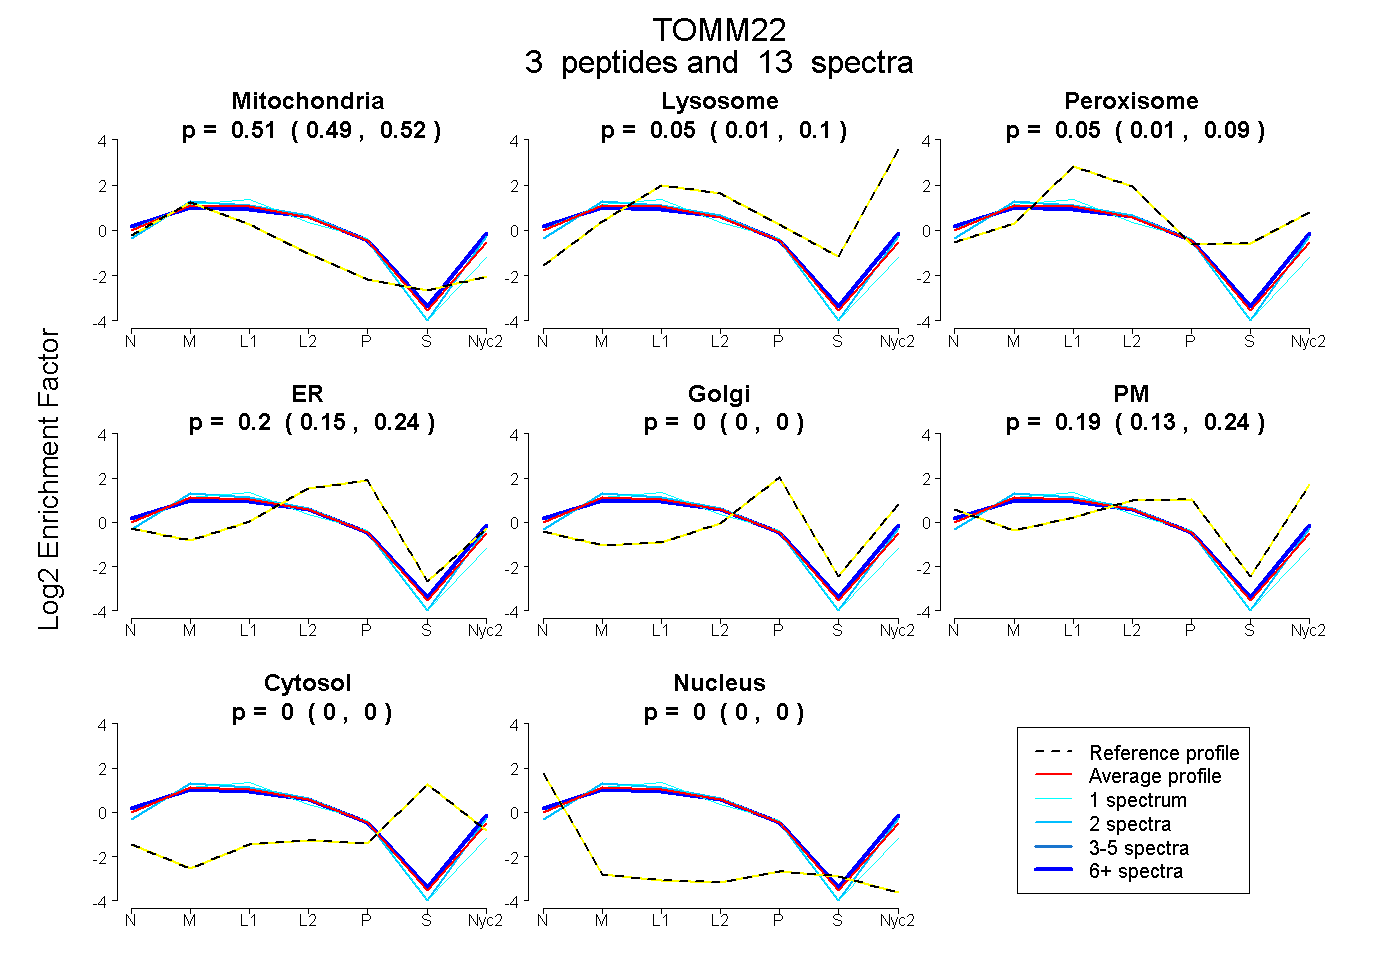
0.492 | 0.520
0.006 | 0.096
0.008 | 0.085
0.149 | 0.237
0.000 | 0.000
0.126 | 0.243
0.000 | 0.000
0.000 | 0.000
2peptides
spectra
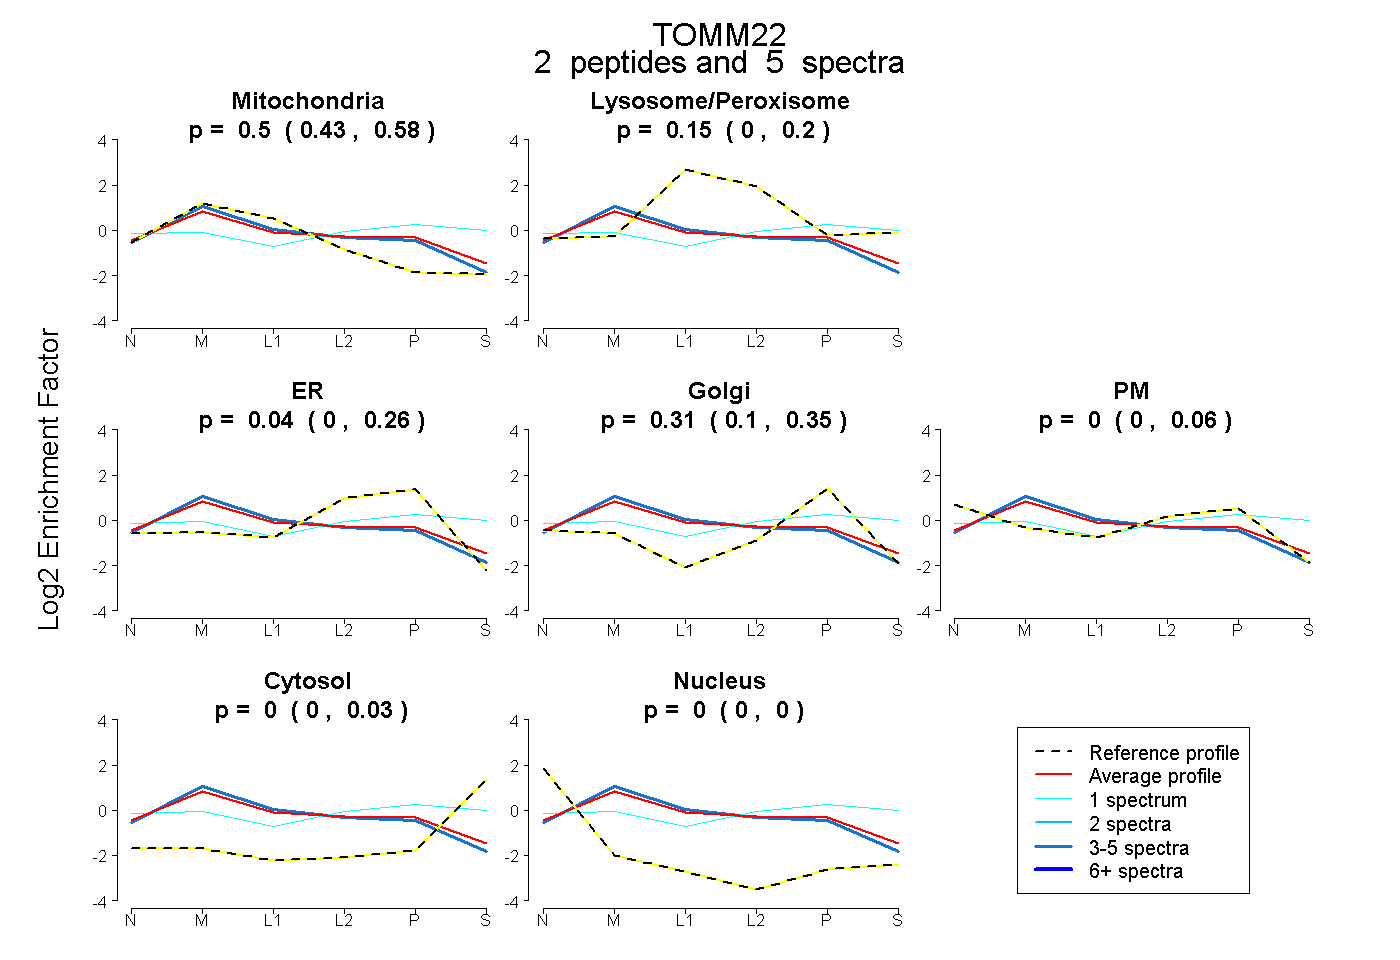
0.427 | 0.577
0.000 | 0.204
0.000 | 0.259
0.097 | 0.354
0.000 | 0.064
0.000 | 0.034
0.000 | 0.000
3peptides
spectra
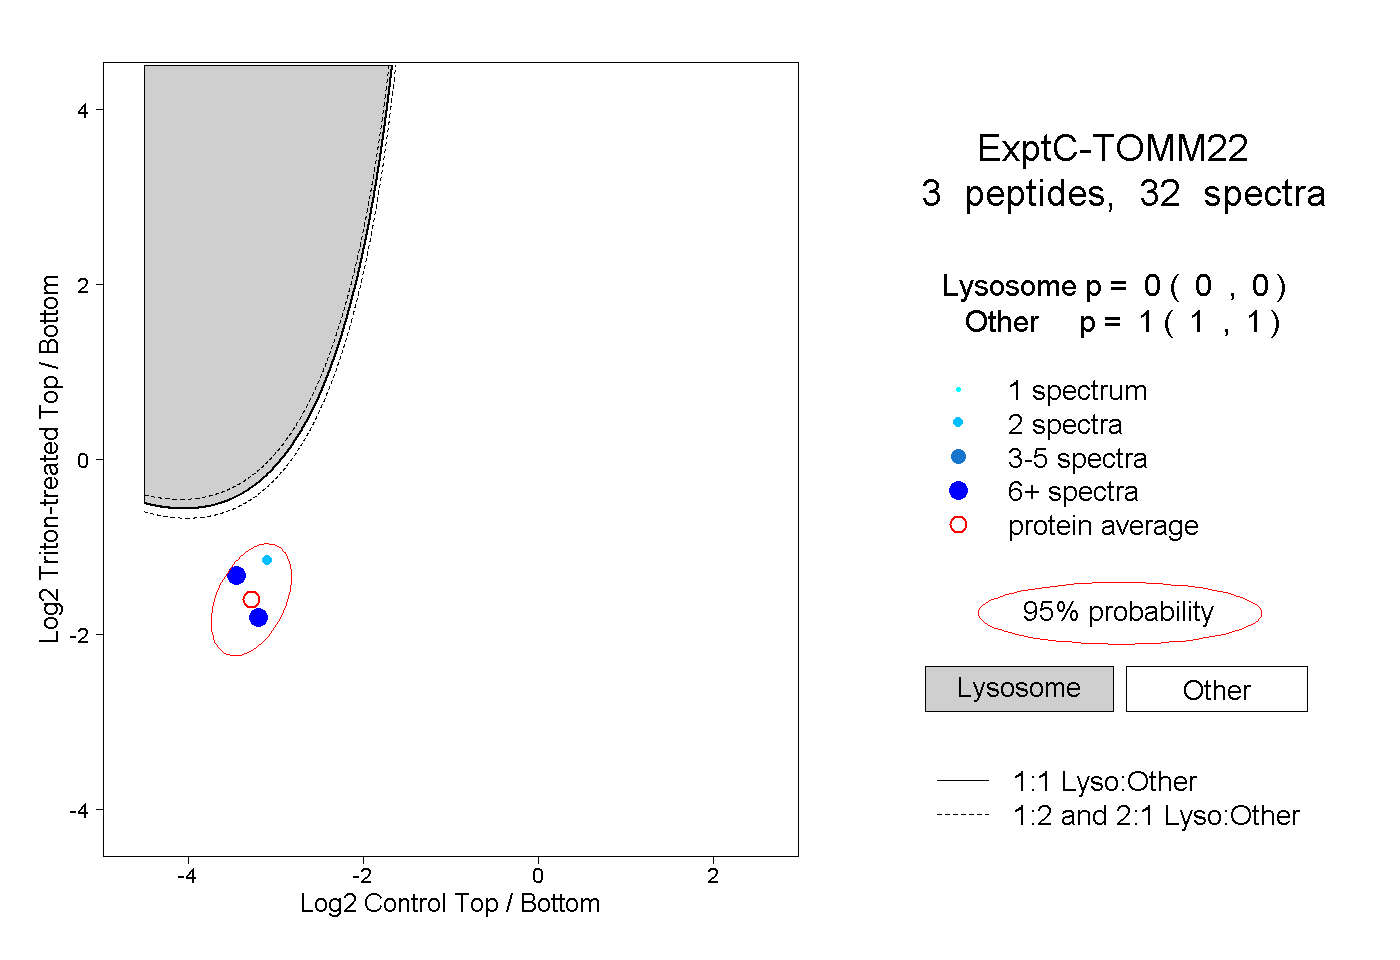
0.000 | 0.000
1.000 | 1.000