CYP4V3
[ENSRNOP00000019302]
Main page
| | | Plot |
Mito |
Lyso |
|
Perox |
ER |
Golgi |
PM |
Cytosol |
Nucleus |
|
| Expt A |
 21
21
peptides |
70
spectra |
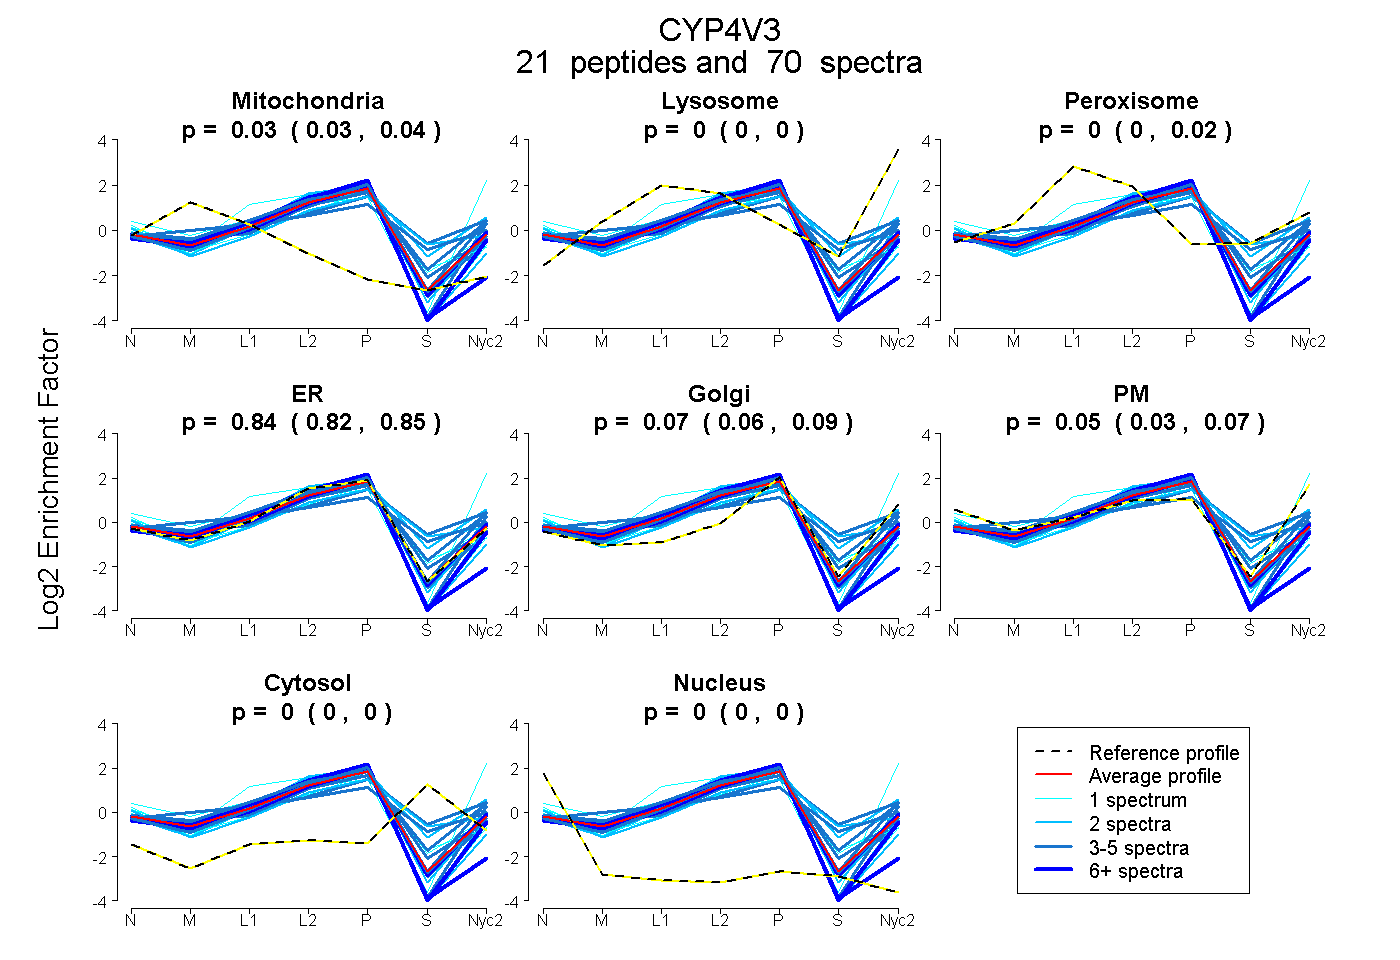 |
0.034
0.028 | 0.038 |
0.000
0.000 | 0.000 |
|
0.005
0.000 | 0.017 |
0.840
0.821 | 0.853 |
0.069
0.057 | 0.087 |
0.053
0.032 | 0.066 |
0.000
0.000 | 0.000 |
0.000
0.000 | 0.000 |
|
| | | Plot |
Mito |
|
Lyso or Perox |
|
ER |
Golgi |
PM |
Cytosol |
Nucleus |
|
| Expt B |
8
peptides |
26
spectra |
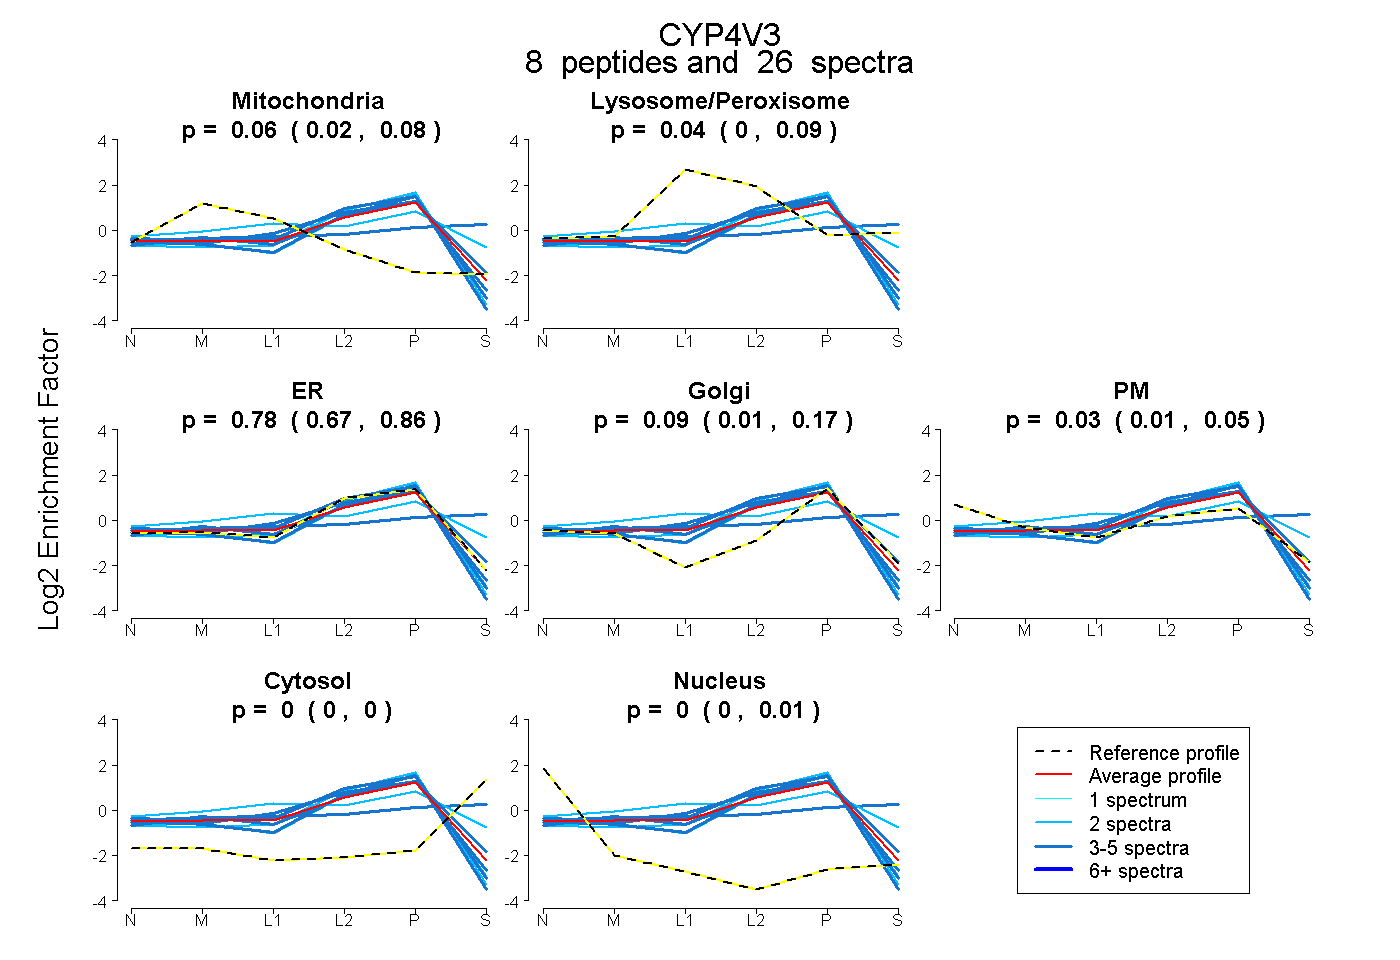 |
0.057
0.023 | 0.080 |
|
0.043
0.000 | 0.092 |
|
0.775
0.668 | 0.864 |
0.091
0.007 | 0.171 |
0.033
0.007 | 0.048 |
0.000
0.000 | 0.000 |
0.000
0.000 | 0.007 |
|
| 2 spectra, ELDDVFGR |
0.000 |
|
0.000 |
|
1.000 |
0.000 |
0.000 |
0.000 |
0.000 |
|
| 3 spectra, YFPDPEEFQPER |
0.000 |
|
0.181 |
|
0.690 |
0.129 |
0.000 |
0.000 |
0.000 |
|
| 4 spectra, VFPSVPLFAR |
0.000 |
|
0.000 |
|
0.909 |
0.070 |
0.000 |
0.000 |
0.022 |
|
| 3 spectra, HLPIIK |
0.073 |
|
0.000 |
|
0.873 |
0.054 |
0.000 |
0.000 |
0.000 |
|
| 5 spectra, GTEAVIIPYALHR |
0.000 |
|
0.388 |
|
0.000 |
0.273 |
0.047 |
0.292 |
0.000 |
|
| 2 spectra, HPYAYVPFSAGPR |
0.020 |
|
0.468 |
|
0.000 |
0.512 |
0.000 |
0.000 |
0.000 |
|
| 2 spectra, FFPENSQGR |
0.000 |
|
0.000 |
|
0.863 |
0.137 |
0.000 |
0.000 |
0.000 |
|
| 5 spectra, TILACILR |
0.000 |
|
0.000 |
|
1.000 |
0.000 |
0.000 |
0.000 |
0.000 |
|
| | | Plot |
|
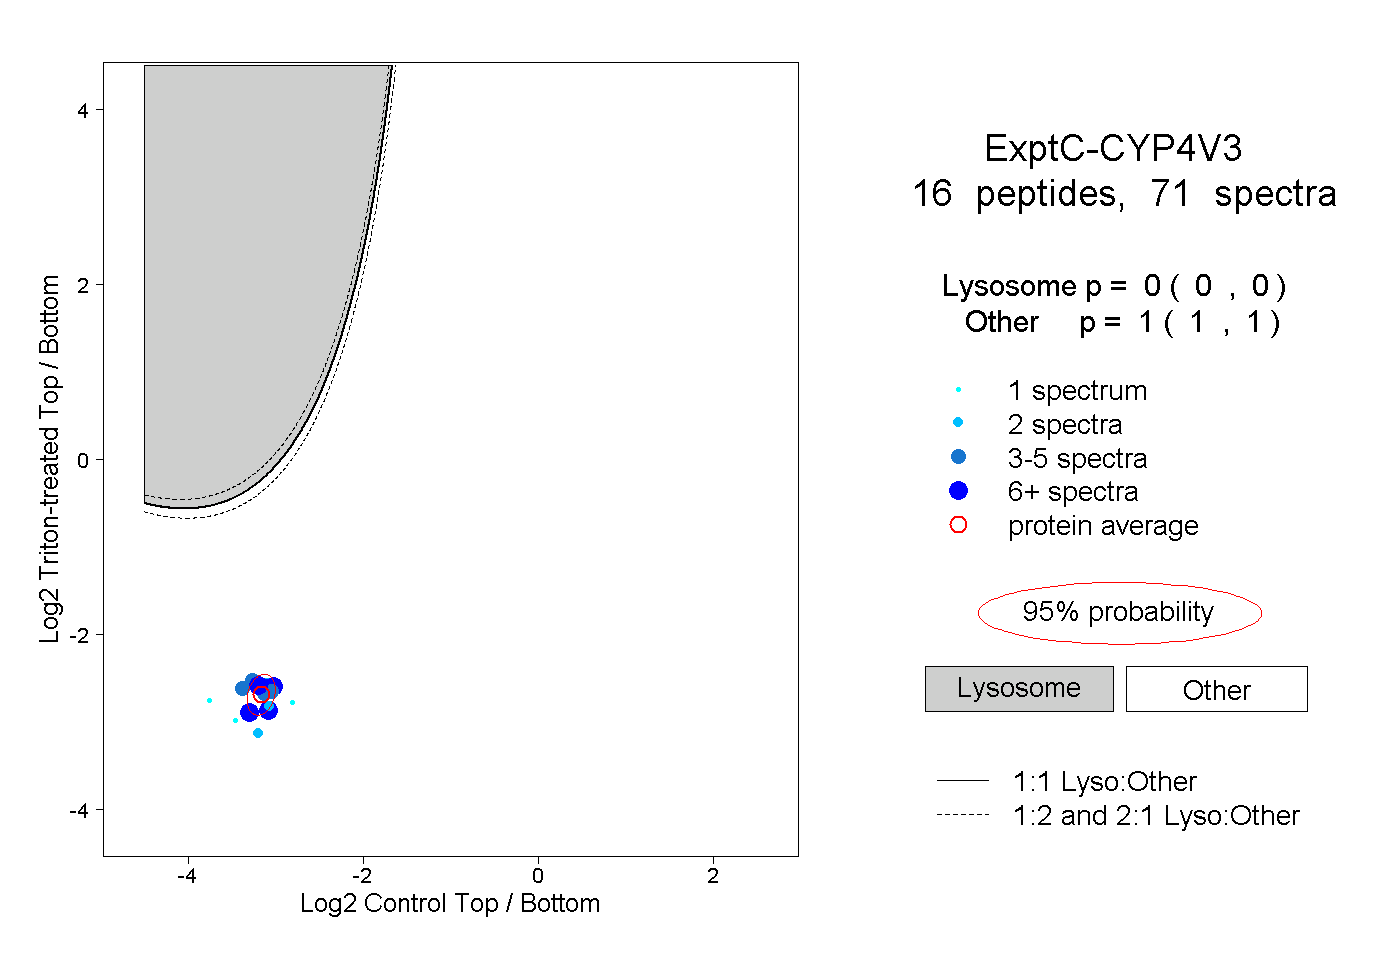
Lyso |
|
|
|
|
|
|
|
Other |
| Expt C |
16
peptides |
71
spectra |
 |
|
0.000
0.000 | 0.000 |
|
|
|
|
|
|
|
1.000
1.000 | 1.000 |
| | | Plot |
|
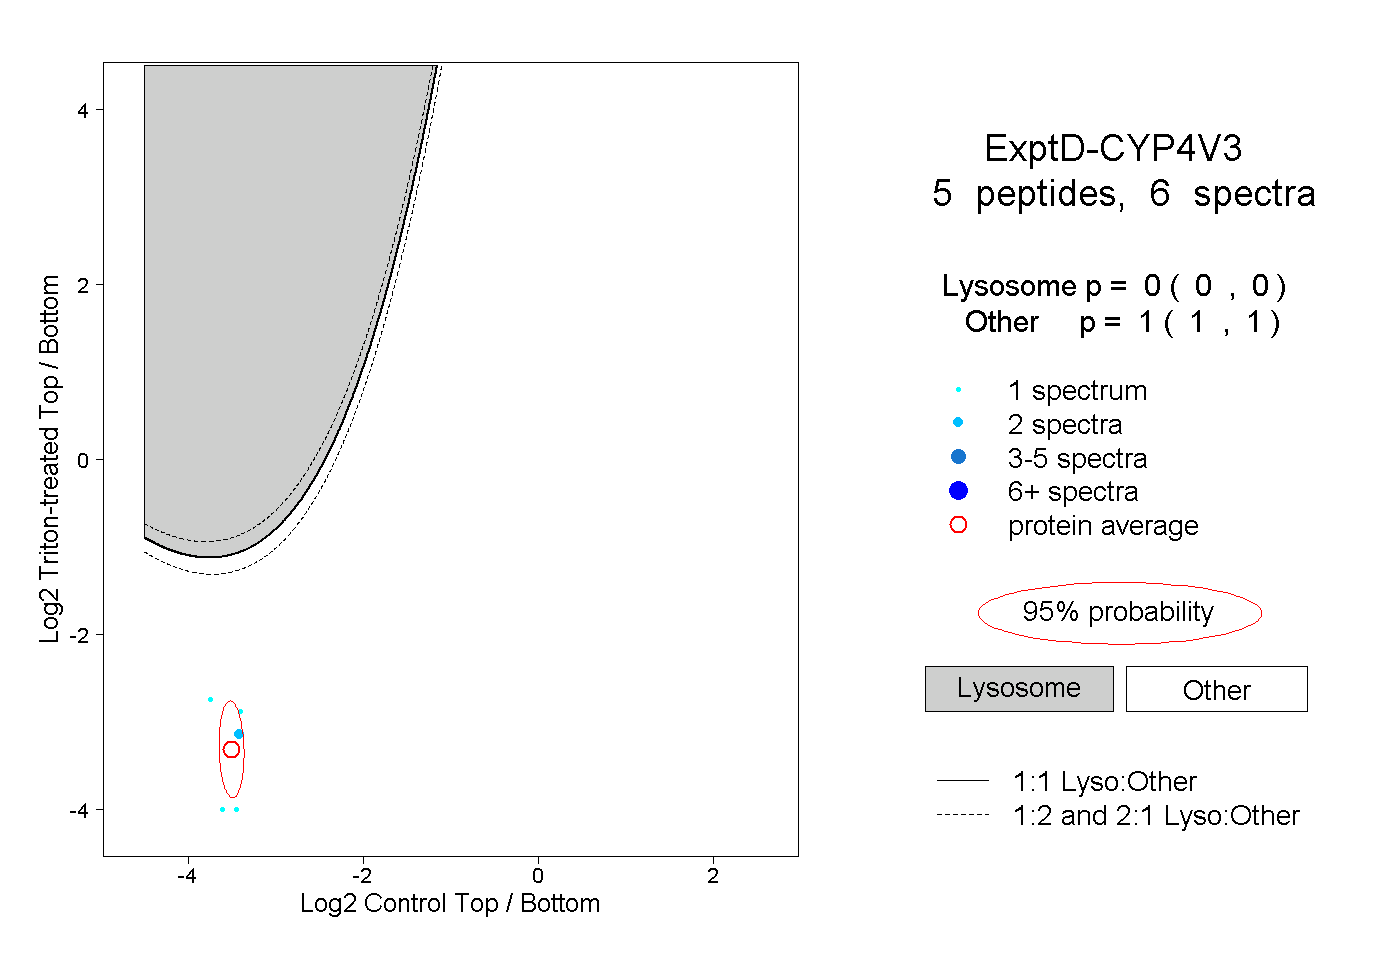
Lyso |
|
|
|
|
|
|
|
Other |
| Expt D |
5
peptides |
6
spectra |
 |
|
0.000
0.000 | 0.000 |
|
|
|
|
|
|
|
1.000
1.000 | 1.000 |