 8
8peptides
spectra
0.000 | 0.000
0.998 | 1.000
0.000 | 0.000
0.000 | 0.000
0.000 | 0.000
0.000 | 0.000
0.000 | 0.000
0.000 | 0.000
| Plot | Mito | Lyso | Perox | ER | Golgi | PM | Cytosol | Nucleus | |||||
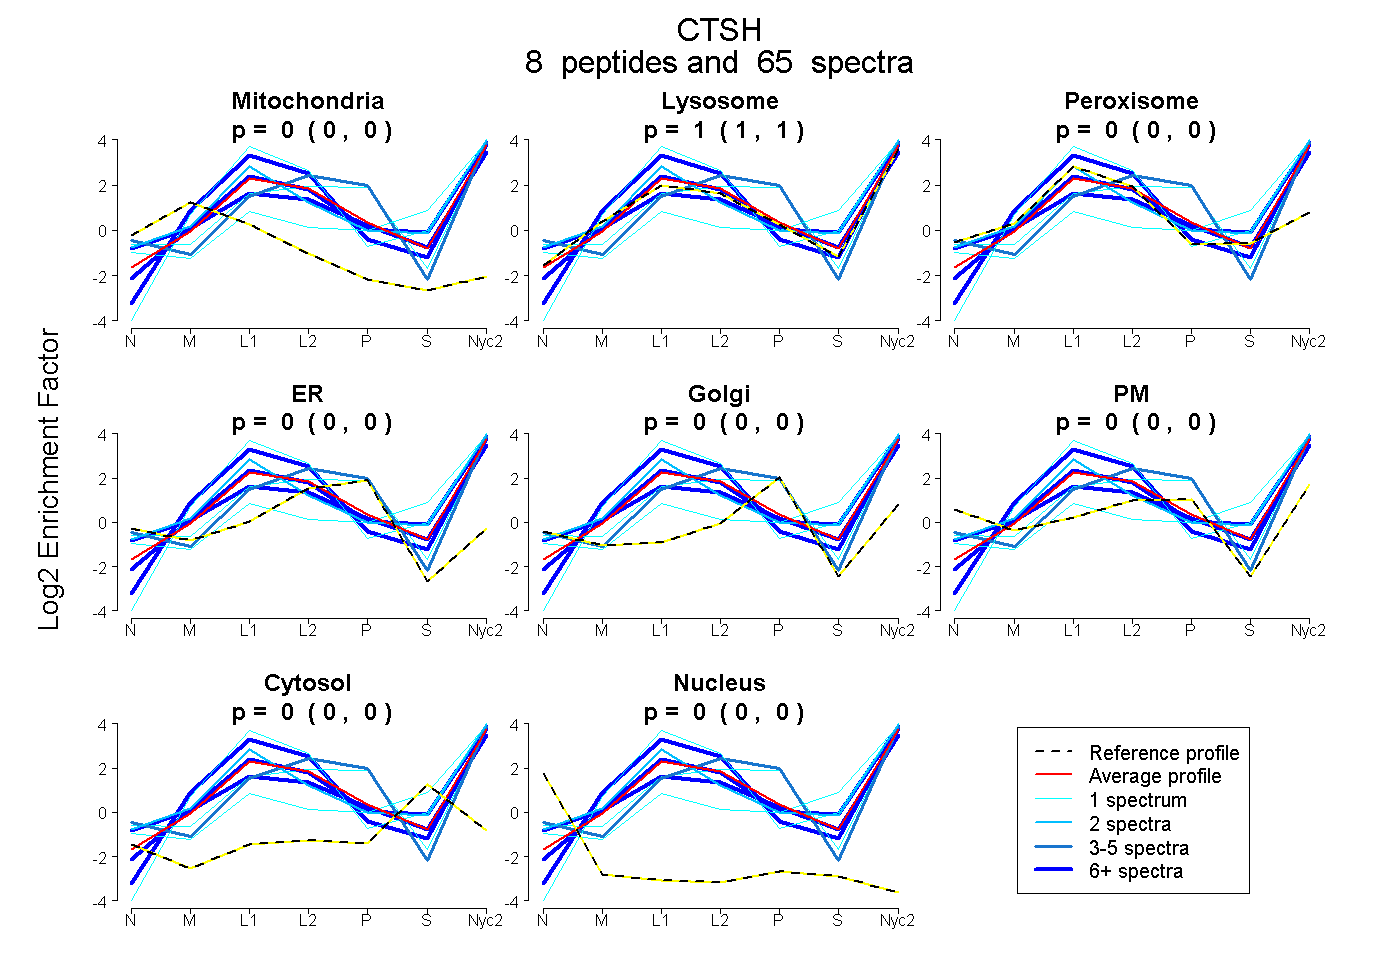
| Expt A |
8 peptides |
65 spectra |
|
0.000 0.000 | 0.000 |
1.000 0.998 | 1.000 |
0.000 0.000 | 0.000 |
0.000 0.000 | 0.000 |
0.000 0.000 | 0.000 |
0.000 0.000 | 0.000 |
0.000 0.000 | 0.000 |
0.000 0.000 | 0.000 |
| 1 spectrum, MGLNQFSDMSFAEIK | 0.000 | 0.701 | 0.000 | 0.000 | 0.000 | 0.000 | 0.299 | 0.000 | ||
| 2 spectra, SGVYSSNSCHK | 0.000 | 0.897 | 0.103 | 0.000 | 0.000 | 0.000 | 0.000 | 0.000 | ||
| 21 spectra, GIMGEDSYPYIGK | 0.000 | 0.847 | 0.000 | 0.000 | 0.000 | 0.098 | 0.055 | 0.000 | ||
| 4 spectra, LQVFANNWR | 0.000 | 0.599 | 0.000 | 0.006 | 0.000 | 0.396 | 0.000 | 0.000 | ||
| 1 spectrum, NSWGSNWGNNGYFLIER | 0.000 | 1.000 | 0.000 | 0.000 | 0.000 | 0.000 | 0.000 | 0.000 | ||
| 22 spectra, GNVVSPVK | 0.000 | 1.000 | 0.000 | 0.000 | 0.000 | 0.000 | 0.000 | 0.000 | ||
| 1 spectrum, GTGPYPSSMDWR | 0.000 | 0.673 | 0.000 | 0.000 | 0.019 | 0.308 | 0.000 | 0.000 | ||
| 13 spectra, AVAFVK | 0.000 | 0.994 | 0.000 | 0.000 | 0.000 | 0.000 | 0.006 | 0.000 |
| Plot | Mito | Lyso or Perox | ER | Golgi | PM | Cytosol | Nucleus | ||||||
| Expt B |
5 peptides |
33 spectra |
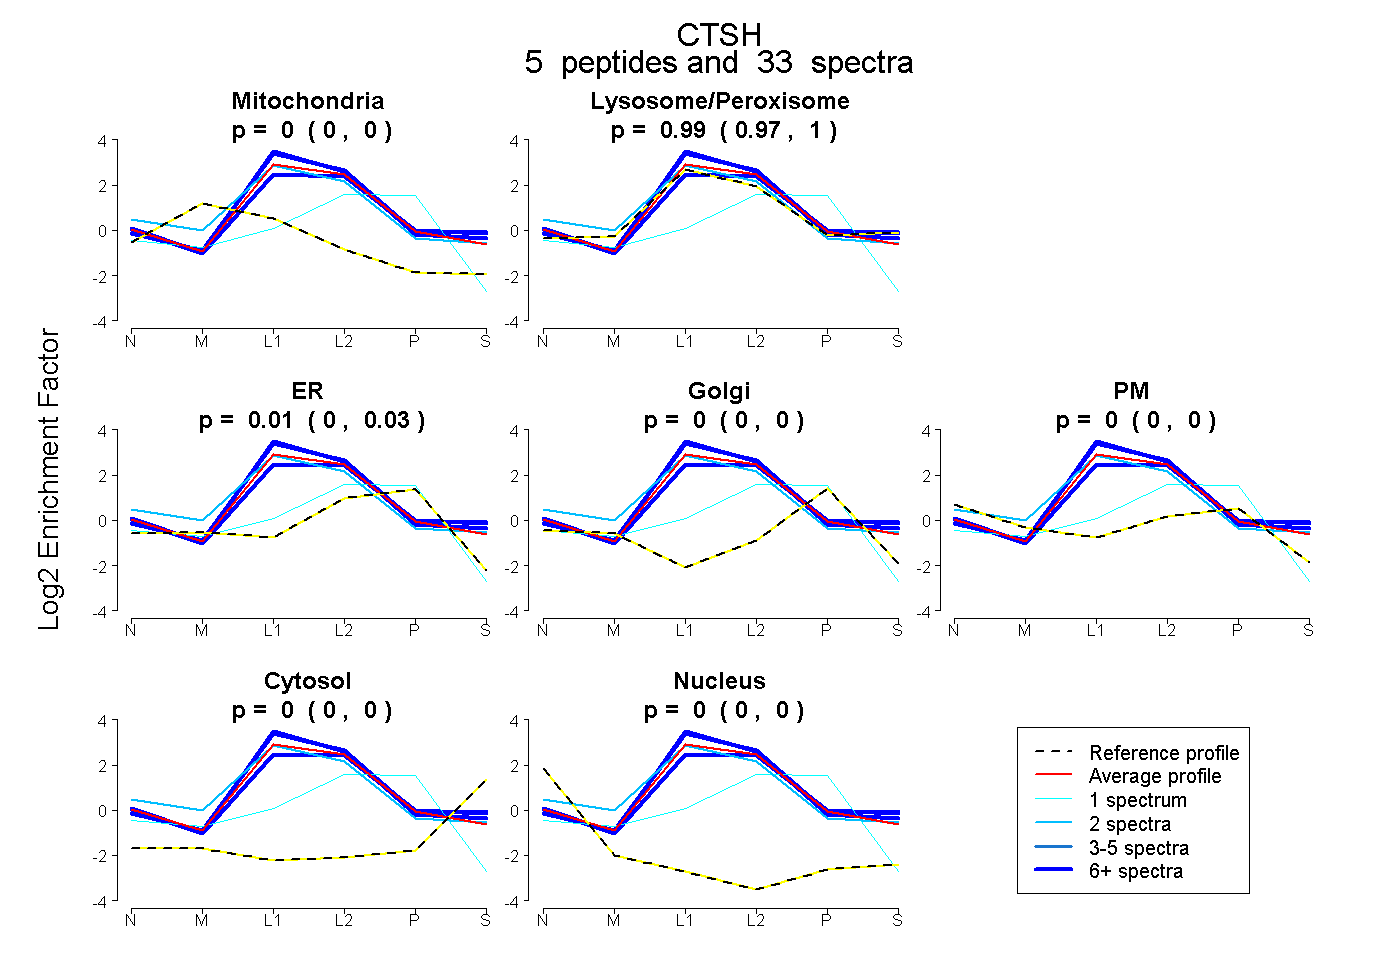 |
0.000 0.000 | 0.000 |
0.994 0.968 | 1.000 |
0.006 0.000 | 0.028 |
0.000 0.000 | 0.000 |
0.000 0.000 | 0.000 |
0.000 0.000 | 0.000 |
0.000 0.000 | 0.000 |
|||
| Plot | Lyso | Other | |||||||||||
| Expt C |
5 peptides |
395 spectra |
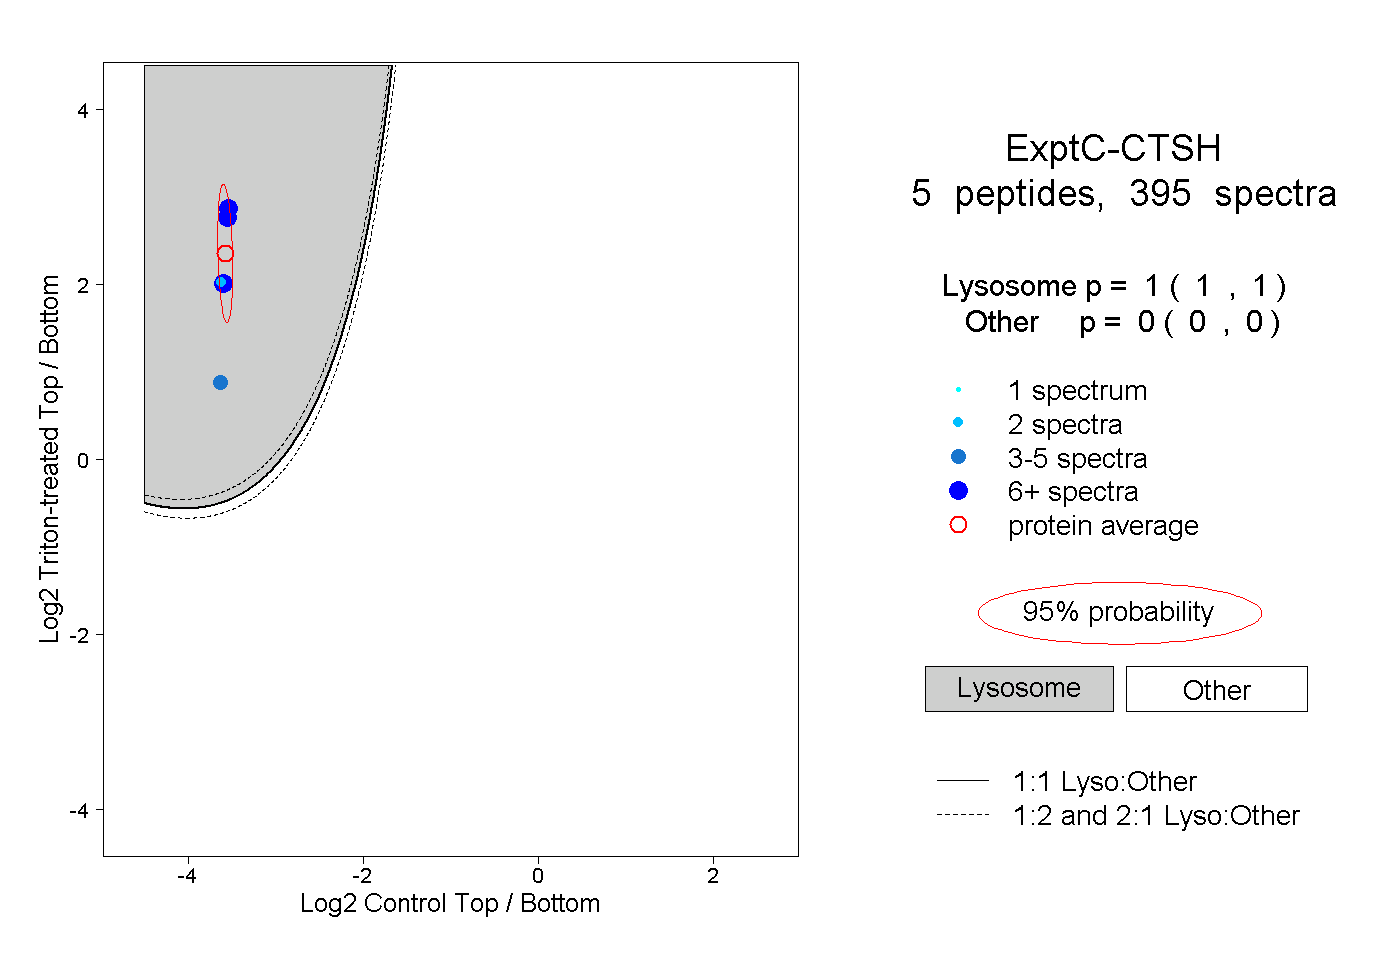 |
1.000 1.000 | 1.000 |
0.000 0.000 | 0.000 |
||||||||
| Plot | Lyso | Other | |||||||||||
| Expt D |
3 peptides |
17 spectra |
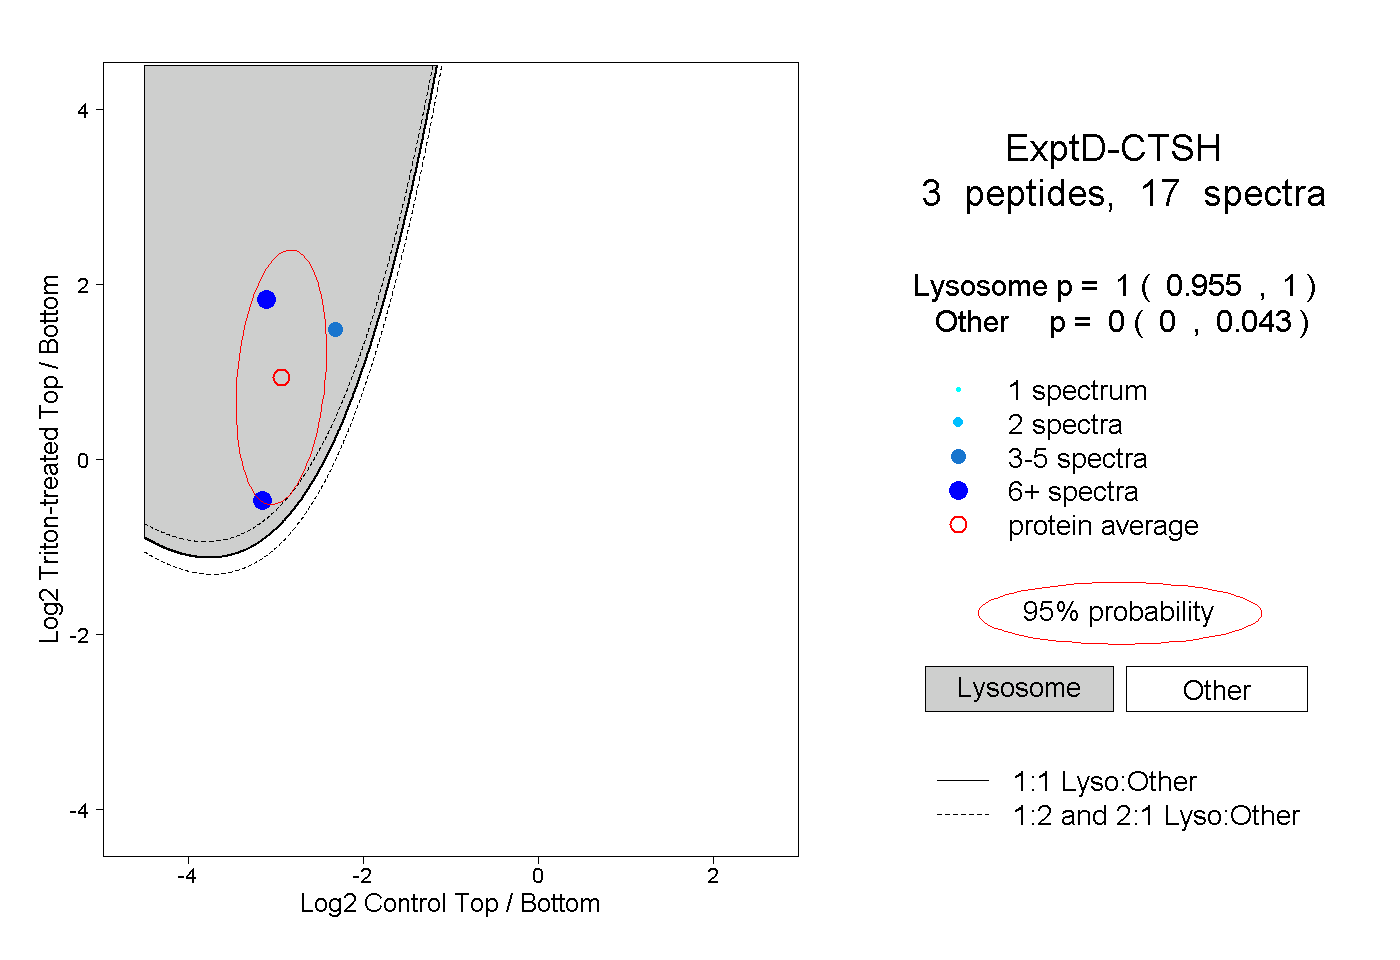 |
1.000 0.955 | 1.000 |
0.000 0.000 | 0.043 |