RPL27A
[ENSRNOP00000019247]
Main page
| | | Plot |
Mito |
Lyso |
|
Perox |
ER |
Golgi |
PM |
Cytosol |
Nucleus |
|
| Expt A |
 6
6
peptides |
42
spectra |
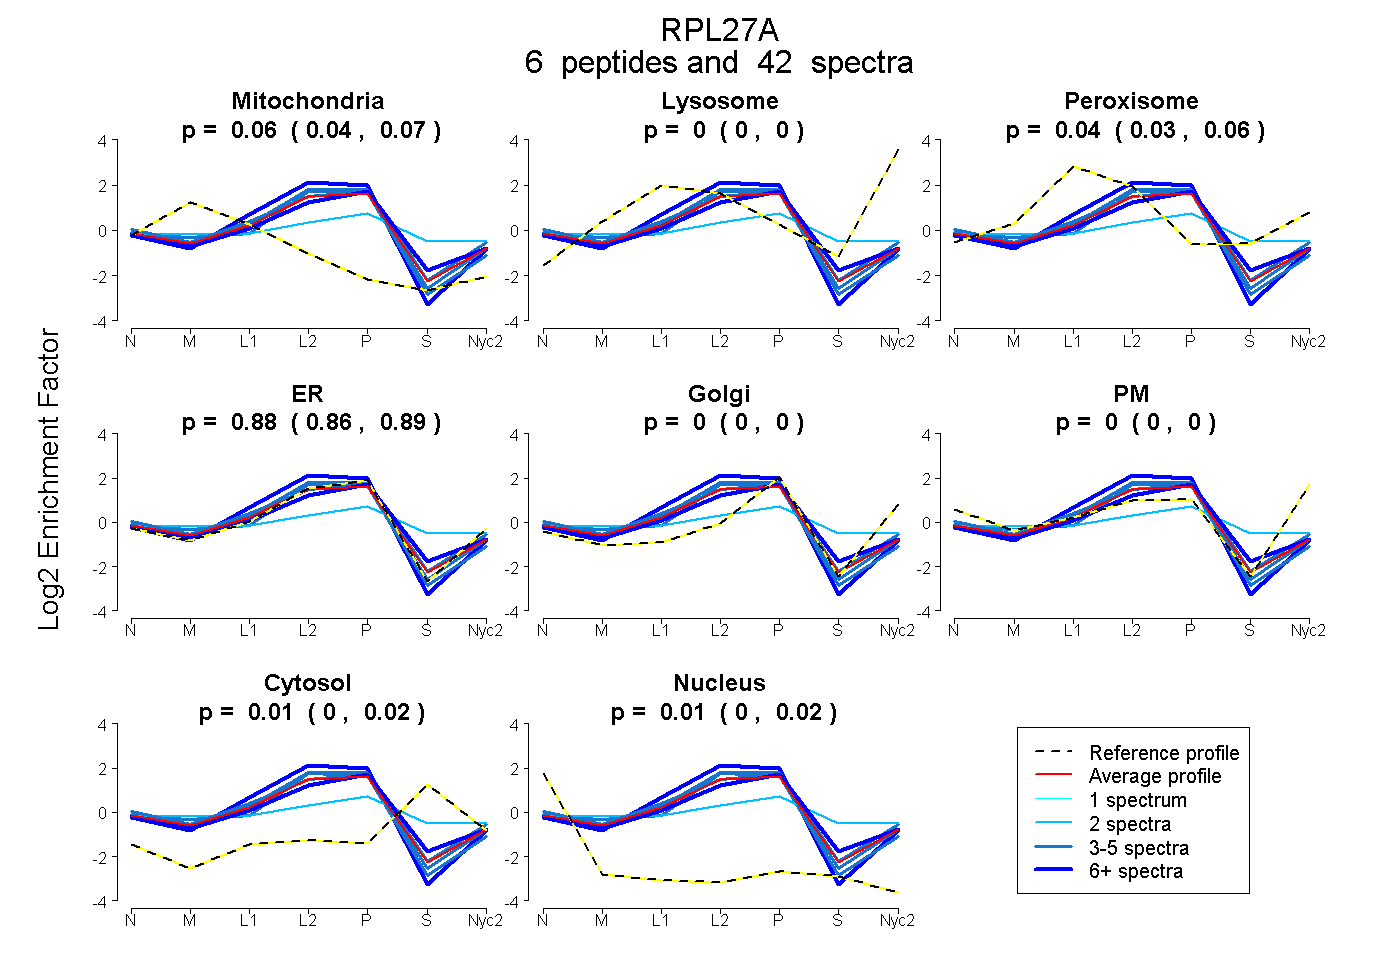 |
0.057
0.045 | 0.067 |
0.000
0.000 | 0.000 |
|
0.045
0.030 | 0.058 |
0.879
0.861 | 0.892 |
0.000
0.000 | 0.000 |
0.000
0.000 | 0.000 |
0.009
0.000 | 0.023 |
0.011
0.003 | 0.017 |
|
| | | Plot |
Mito |
|
Lyso or Perox |
|
ER |
Golgi |
PM |
Cytosol |
Nucleus |
|
| Expt B |
6
peptides |
25
spectra |
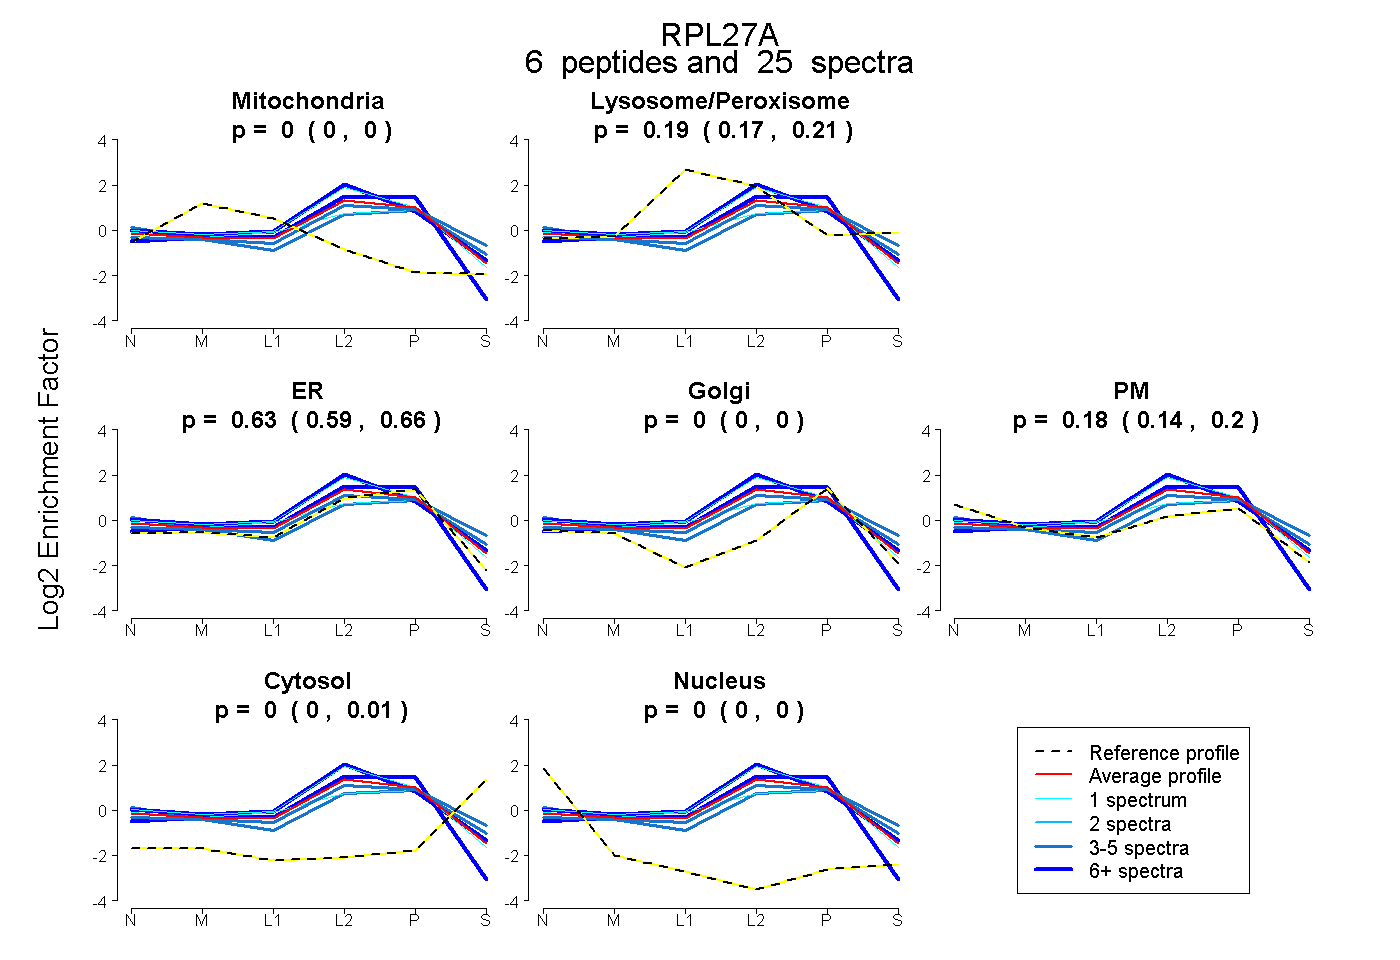 |
0.000
0.000 | 0.000 |
|
0.192
0.172 | 0.209 |
|
0.632
0.595 | 0.663 |
0.000
0.000 | 0.000 |
0.176
0.141 | 0.198 |
0.000
0.000 | 0.011 |
0.000
0.000 | 0.000 |
|
| 1 spectrum, QPVIVK |
0.000 |
|
0.434 |
|
0.028 |
0.448 |
0.090 |
0.000 |
0.000 |
|
| 7 spectra, NGVAPIIDVVR |
0.000 |
|
0.008 |
|
0.992 |
0.000 |
0.000 |
0.000 |
0.000 |
|
| 4 spectra, GVGGACVLVA |
0.000 |
|
0.081 |
|
0.397 |
0.000 |
0.427 |
0.094 |
0.000 |
|
| 1 spectrum, NQSFCPTVNLDK |
0.000 |
|
0.263 |
|
0.693 |
0.000 |
0.044 |
0.000 |
0.000 |
|
| 7 spectra, LWTLVSEQTR |
0.000 |
|
0.317 |
|
0.614 |
0.000 |
0.069 |
0.000 |
0.000 |
|
| 5 spectra, YHPGYFGK |
0.000 |
|
0.215 |
|
0.590 |
0.002 |
0.068 |
0.125 |
0.000 |
|
| | | Plot |
|
Lyso |
|
|
|
|
|
|
|
Other |
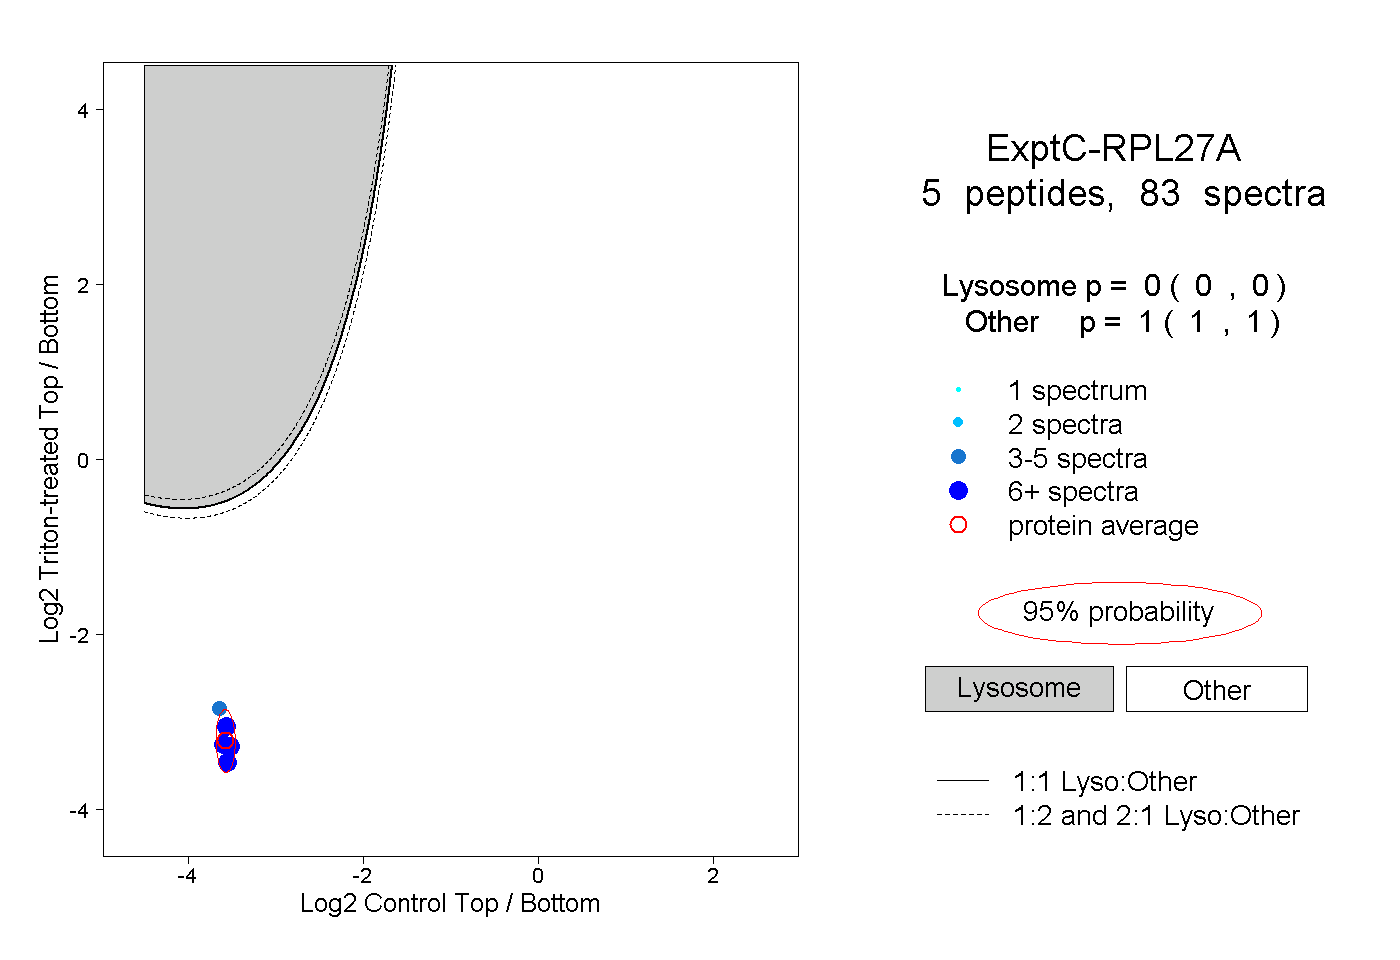
| Expt C |
5
peptides |
83
spectra |
 |
|
0.000
0.000 | 0.000 |
|
|
|
|
|
|
|
1.000
1.000 | 1.000 |
| | | Plot |
|
Lyso |
|
|
|
|
|
|
|
Other |
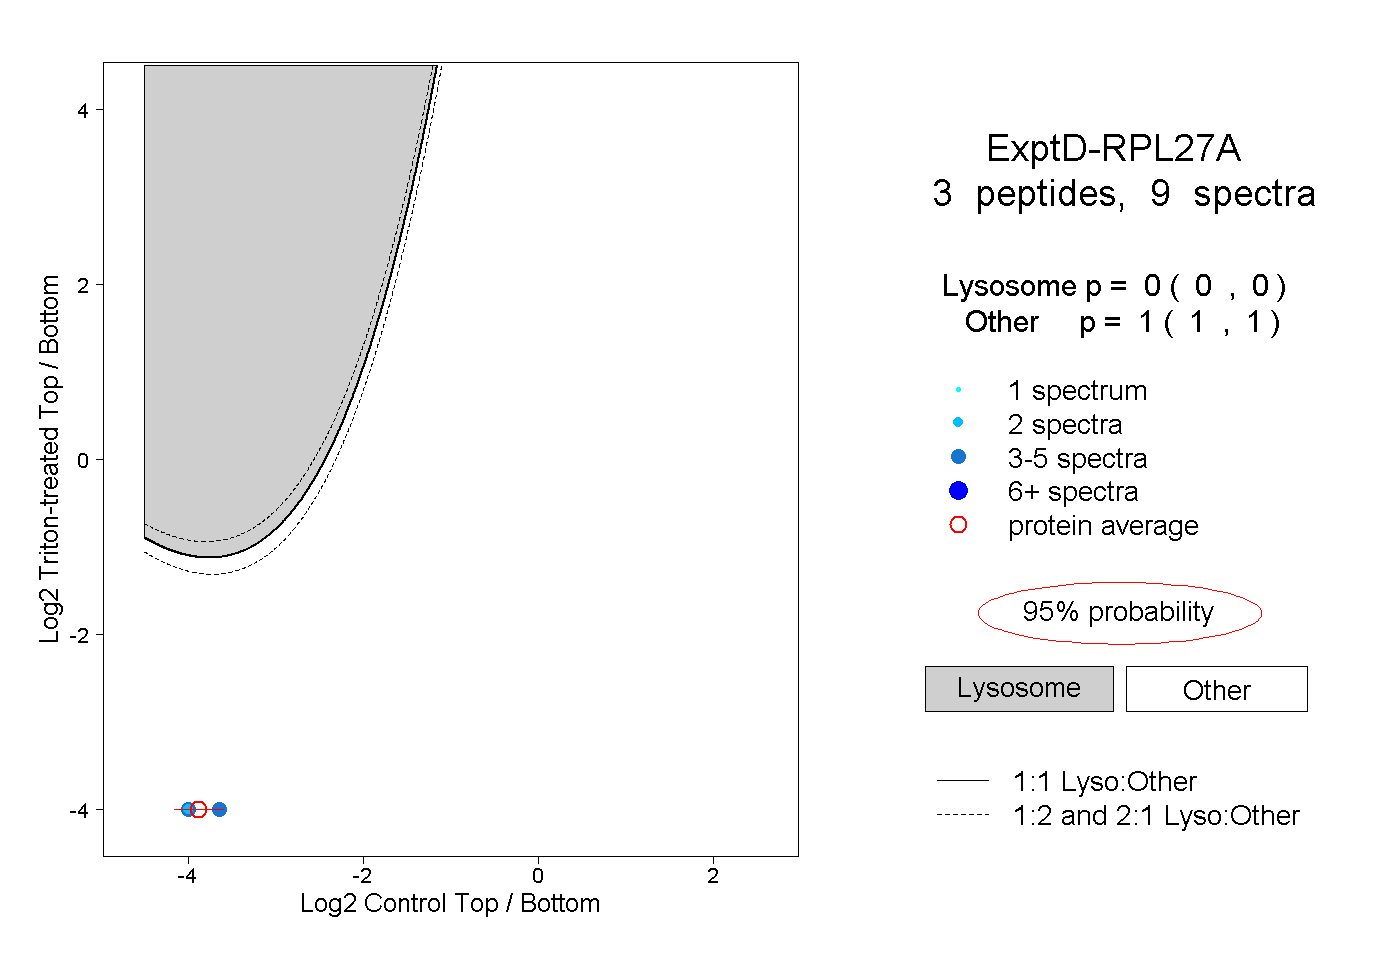
| Expt D |
3
peptides |
9
spectra |
 |
|
0.000
0.000 | 0.000 |
|
|
|
|
|
|
|
1.000
1.000 | 1.000 |