 6
6peptides
spectra
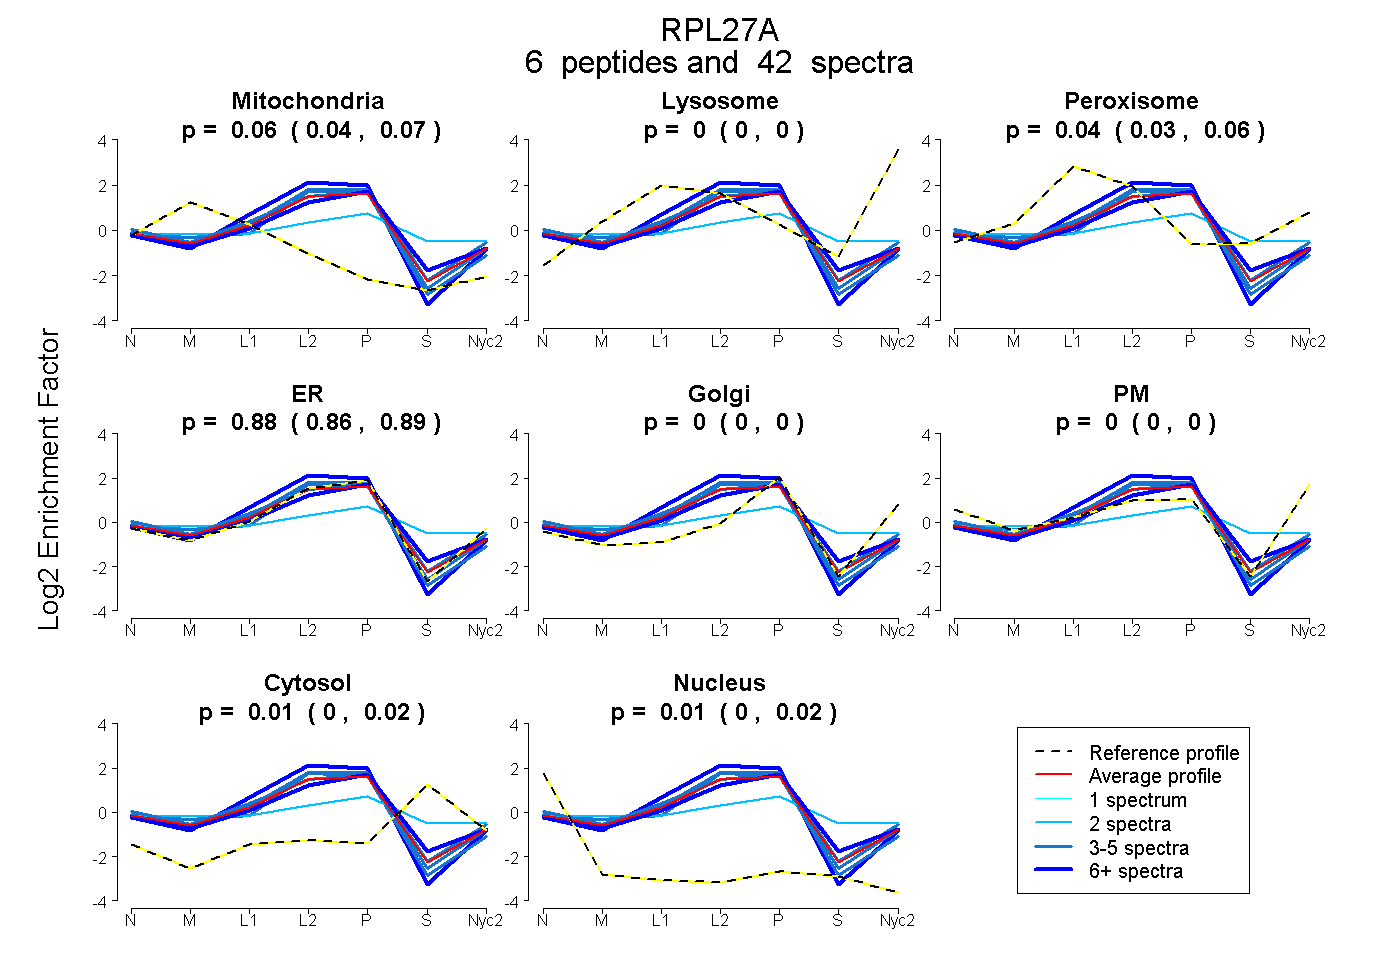
0.045 | 0.067
0.000 | 0.000
0.030 | 0.058
0.861 | 0.892
0.000 | 0.000
0.000 | 0.000
0.000 | 0.023
0.003 | 0.017
| Plot | Mito | Lyso | Perox | ER | Golgi | PM | Cytosol | Nucleus | |||||
| Expt A |
6 peptides |
42 spectra |
|
0.057 0.045 | 0.067 |
0.000 0.000 | 0.000 |
0.045 0.030 | 0.058 |
0.879 0.861 | 0.892 |
0.000 0.000 | 0.000 |
0.000 0.000 | 0.000 |
0.009 0.000 | 0.023 |
0.011 0.003 | 0.017 |
| 5 spectra, QPVIVK | 0.074 | 0.000 | 0.026 | 0.901 | 0.000 | 0.000 | 0.000 | 0.000 | ||
| 5 spectra, NGVAPIIDVVR | 0.094 | 0.000 | 0.000 | 0.906 | 0.000 | 0.000 | 0.000 | 0.000 | ||
| 8 spectra, HYHLK | 0.000 | 0.000 | 0.000 | 1.000 | 0.000 | 0.000 | 0.000 | 0.000 | ||
| 2 spectra, NQSFCPTVNLDK | 0.093 | 0.000 | 0.189 | 0.300 | 0.159 | 0.000 | 0.260 | 0.000 | ||
| 4 spectra, LWTLVSEQTR | 0.000 | 0.000 | 0.089 | 0.911 | 0.000 | 0.000 | 0.000 | 0.000 | ||
| 18 spectra, YHPGYFGK | 0.016 | 0.000 | 0.036 | 0.841 | 0.000 | 0.000 | 0.107 | 0.000 |
| Plot | Mito | Lyso or Perox | ER | Golgi | PM | Cytosol | Nucleus | ||||||
| Expt B |
6 peptides |
25 spectra |
 |
0.000 0.000 | 0.000 |
0.192 0.172 | 0.209 |
0.632 0.595 | 0.663 |
0.000 0.000 | 0.000 |
0.176 0.141 | 0.198 |
0.000 0.000 | 0.011 |
0.000 0.000 | 0.000 |
|||
| Plot | Lyso | Other | |||||||||||
| Expt C |
5 peptides |
83 spectra |
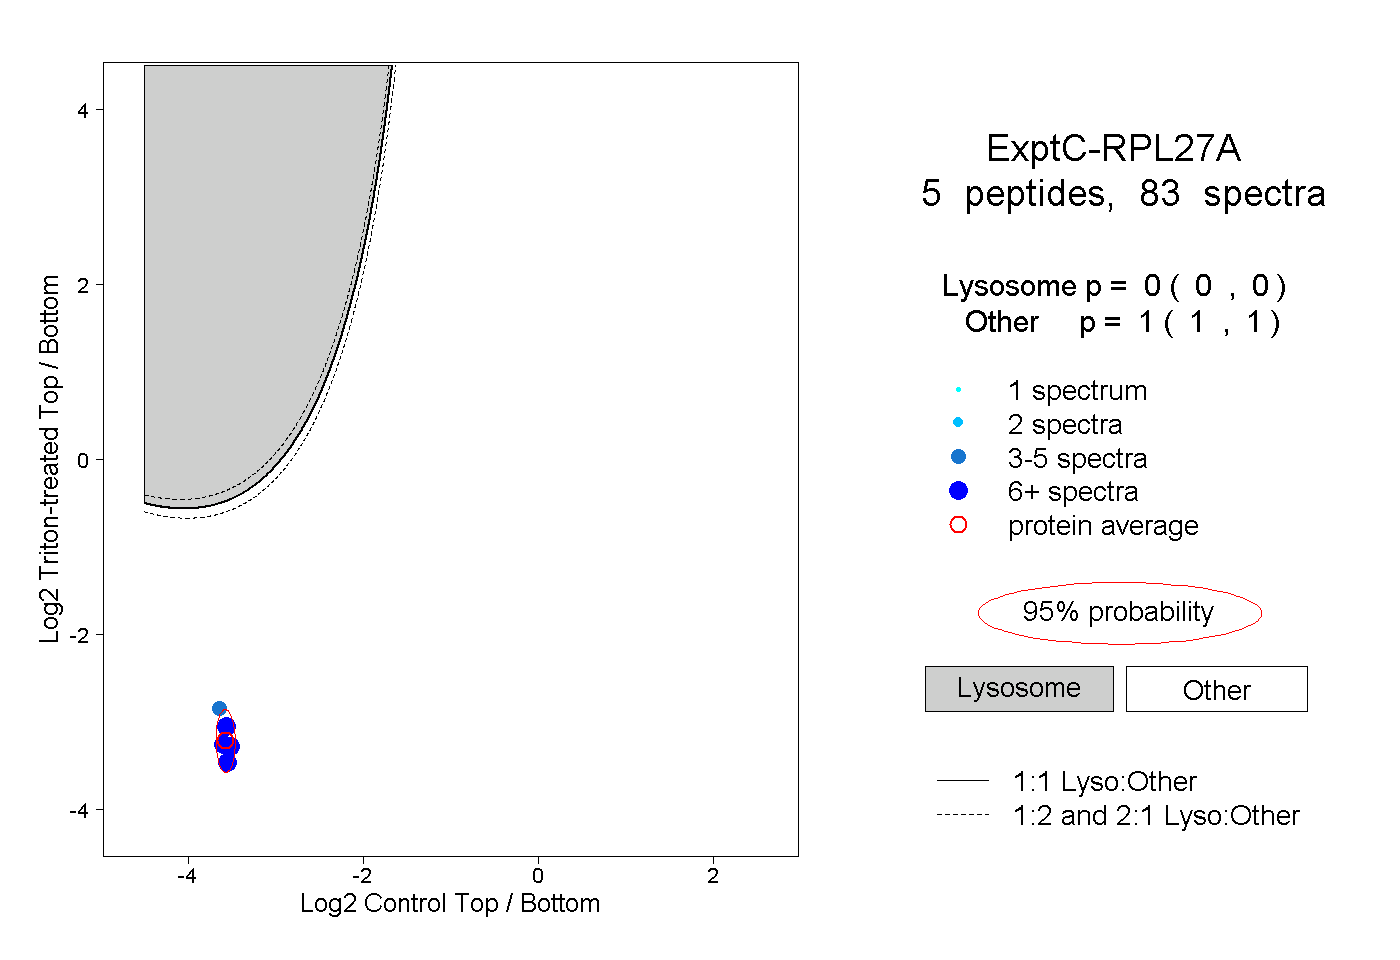 |
0.000 0.000 | 0.000 |
1.000 1.000 | 1.000 |
||||||||
| Plot | Lyso | Other | |||||||||||
| Expt D |
3 peptides |
9 spectra |
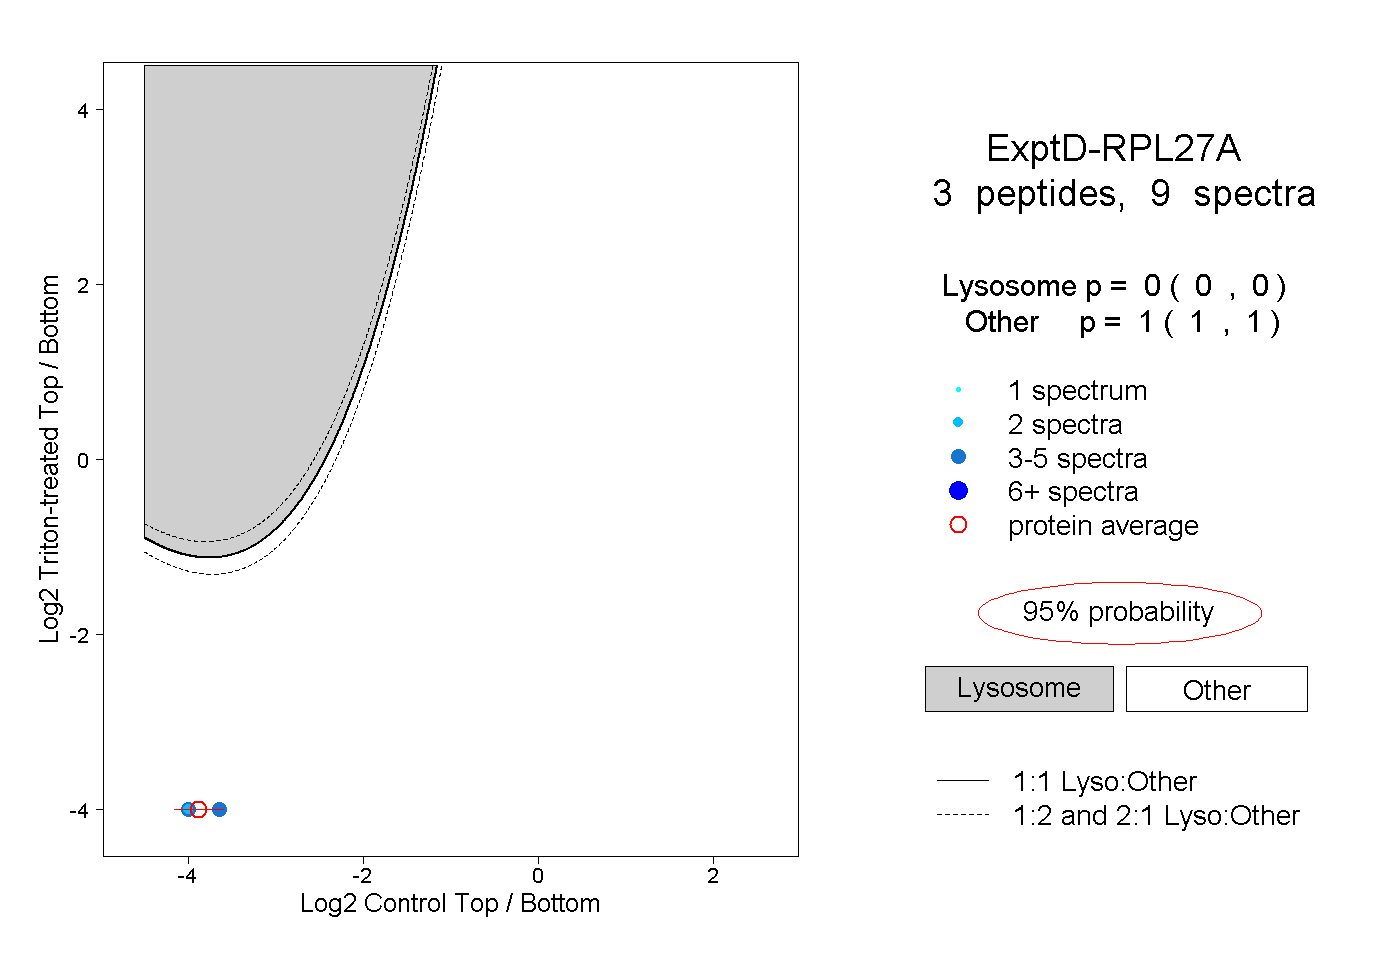 |
0.000 0.000 | 0.000 |
1.000 1.000 | 1.000 |