 1
1peptide
spectrum
NA | NA
NA | NA
NA | NA
NA | NA
NA | NA
NA | NA
NA | NA
NA | NA
| Plot | Mito | Lyso | Perox | ER | Golgi | PM | Cytosol | Nucleus | |||||
| Expt A |
1 peptide |
1 spectrum |
|
0.348 NA | NA |
0.008 NA | NA |
0.088 NA | NA |
0.209 NA | NA |
0.000 NA | NA |
0.347 NA | NA |
0.000 NA | NA |
0.000 NA | NA |
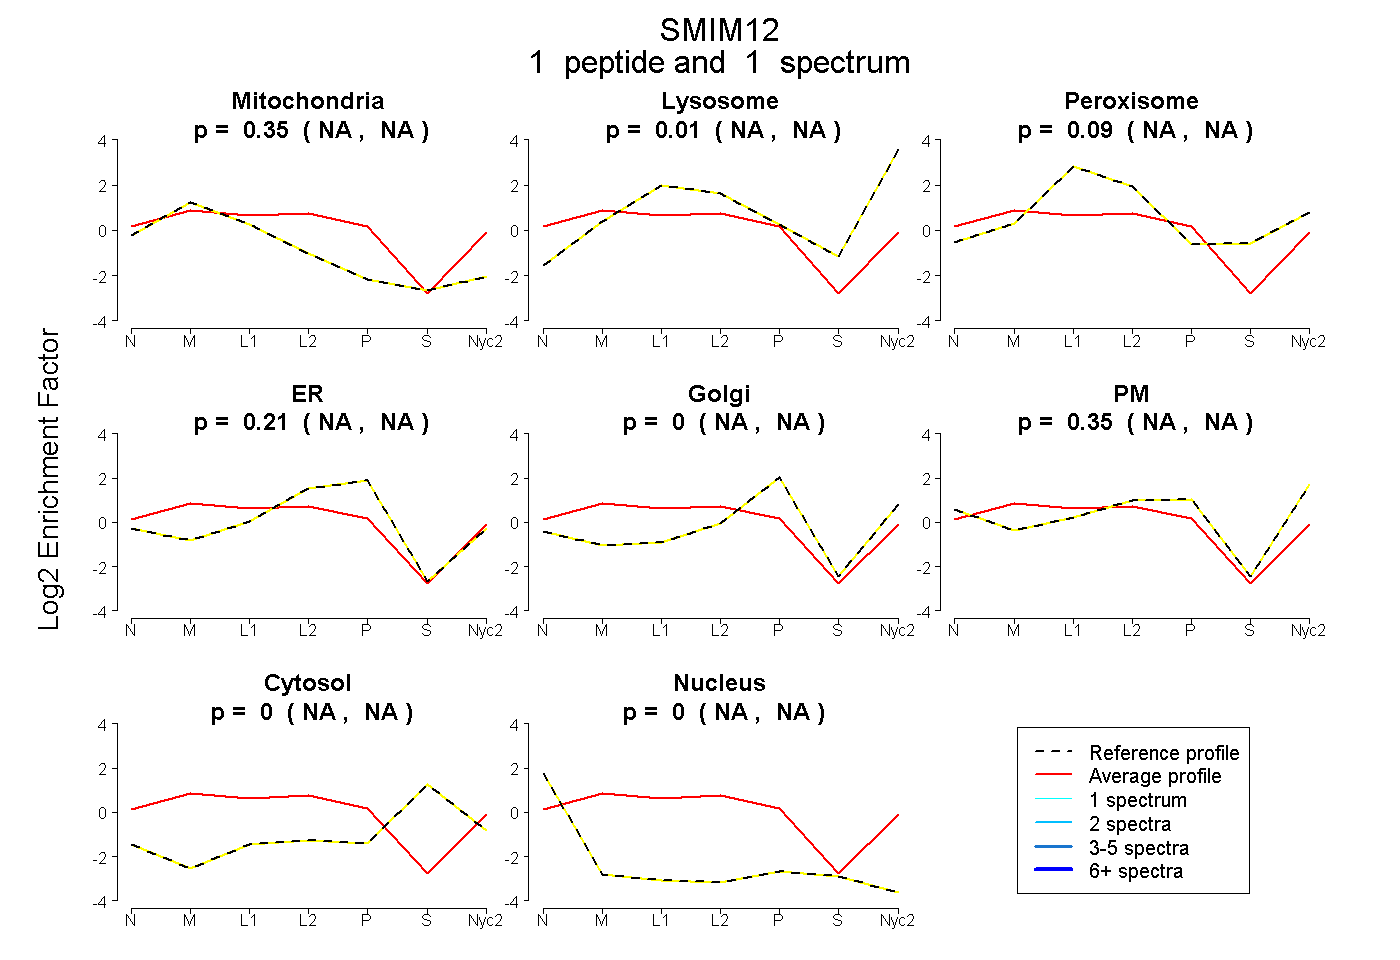
| 1 spectrum, MWPVLWTVVR | 0.348 | 0.008 | 0.088 | 0.209 | 0.000 | 0.347 | 0.000 | 0.000 |
| Plot | Lyso | Other | |||||||||||
| Expt C |
4 peptides |
7 spectra |
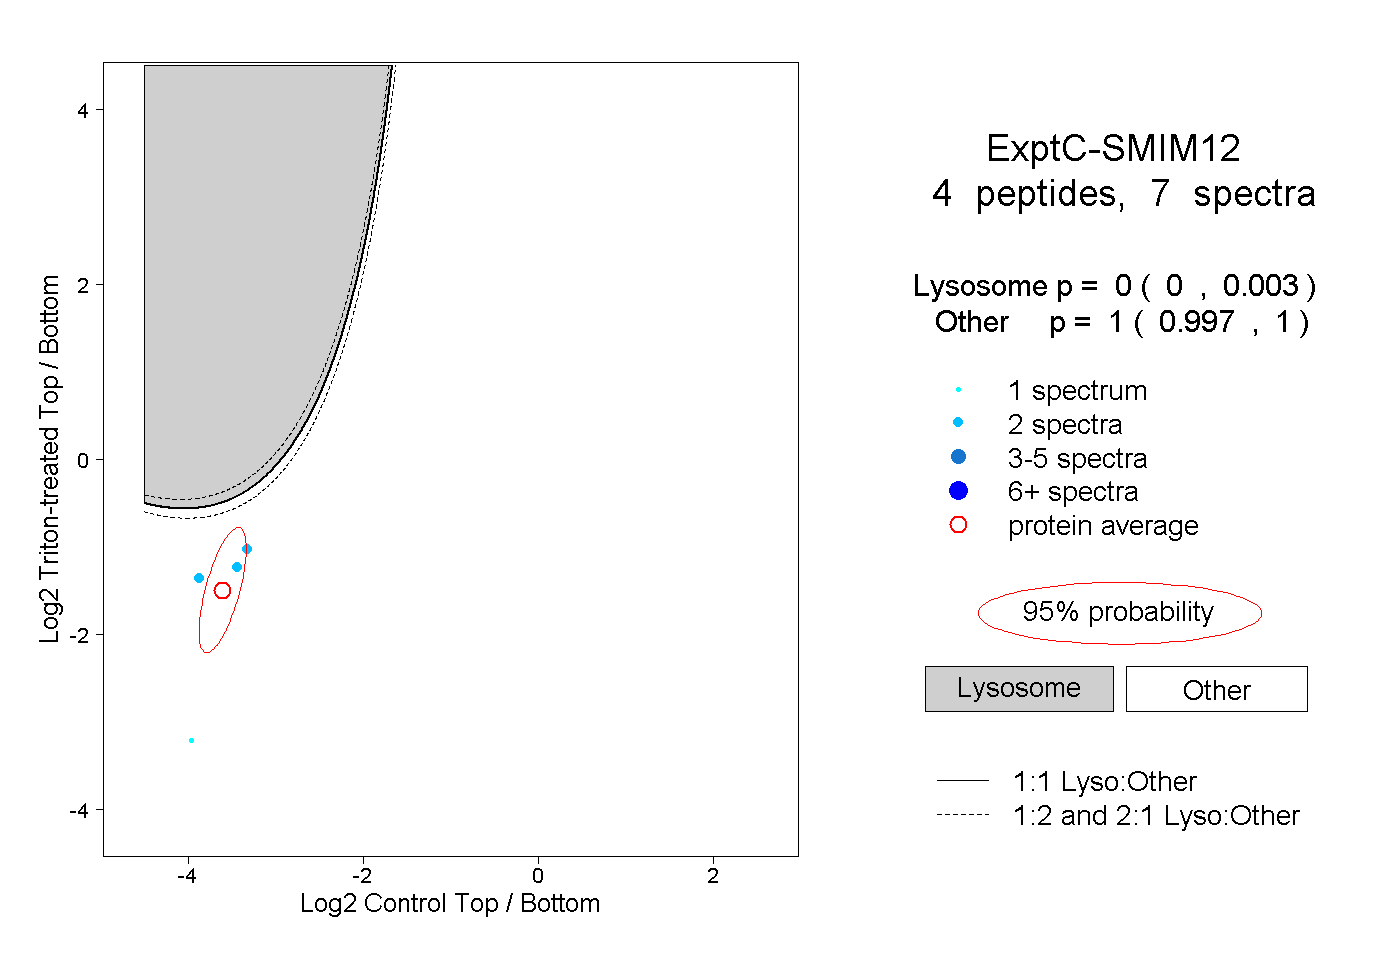 |
0.000 0.000 | 0.003 |
1.000 0.997 | 1.000 |