 5
5peptides
spectra
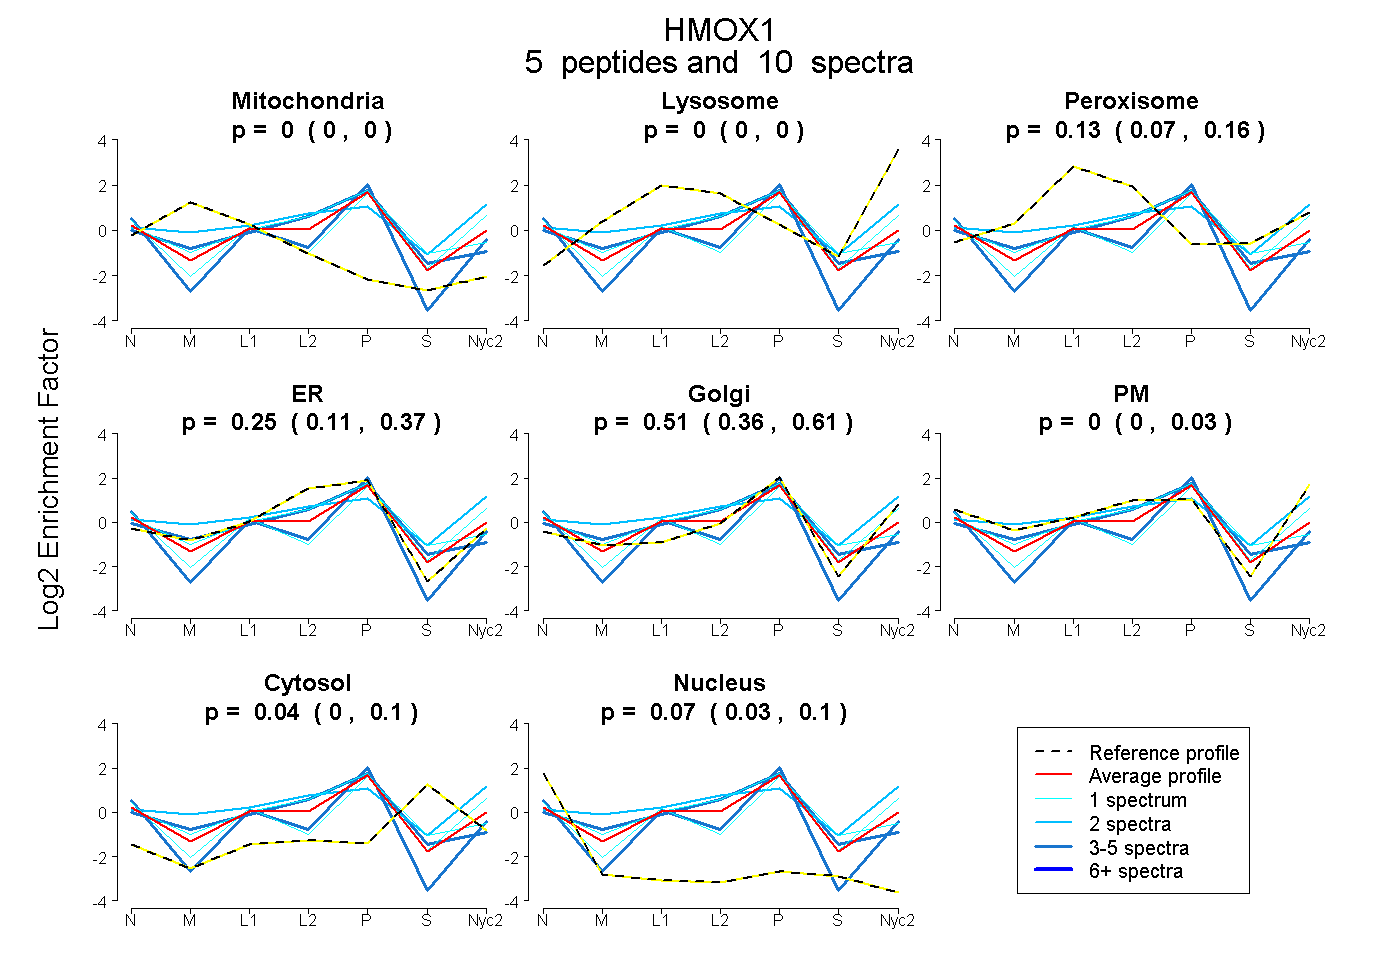
0.000 | 0.000
0.000 | 0.000
0.069 | 0.163
0.107 | 0.373
0.360 | 0.614
0.000 | 0.031
0.000 | 0.103
0.035 | 0.096
| Plot | Mito | Lyso | Perox | ER | Golgi | PM | Cytosol | Nucleus | |||||
| Expt A |
5 peptides |
10 spectra |
|
0.000 0.000 | 0.000 |
0.000 0.000 | 0.000 |
0.126 0.069 | 0.163 |
0.246 0.107 | 0.373 |
0.515 0.360 | 0.614 |
0.000 0.000 | 0.031 |
0.041 0.000 | 0.103 |
0.072 0.035 | 0.096 |
| 3 spectra, QRPASLVQDTTSAETPR | 0.000 | 0.000 | 0.000 | 0.290 | 0.532 | 0.000 | 0.000 | 0.178 | ||
| 1 spectrum, YLGDLSGGQVLK | 0.000 | 0.000 | 0.093 | 0.219 | 0.422 | 0.213 | 0.053 | 0.000 | ||
| 2 spectra, LHEVGGTHPELLVAHAYTR | 0.000 | 0.037 | 0.207 | 0.000 | 0.232 | 0.428 | 0.095 | 0.000 | ||
| 1 spectrum, SQISTSSSQTPLLR | 0.000 | 0.000 | 0.072 | 0.114 | 0.515 | 0.000 | 0.200 | 0.100 | ||
| 3 spectra, AENSEFMR | 0.019 | 0.000 | 0.000 | 0.789 | 0.000 | 0.000 | 0.173 | 0.020 |
| Plot | Lyso | Other | |||||||||||
| Expt C |
7 peptides |
33 spectra |
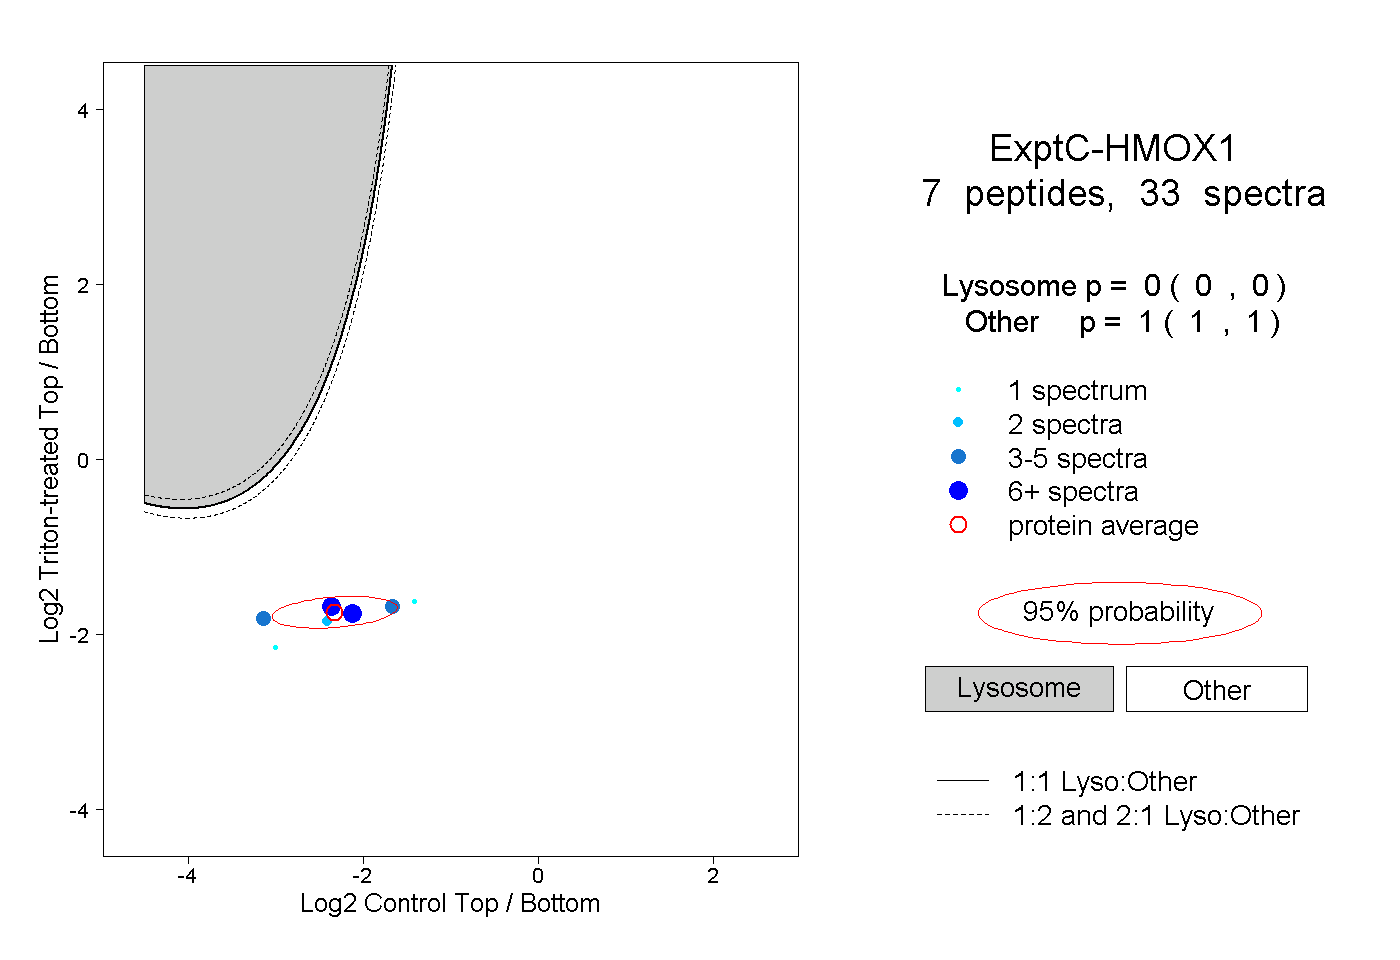 |
0.000 0.000 | 0.000 |
1.000 1.000 | 1.000 |