 1
1peptide
spectrum
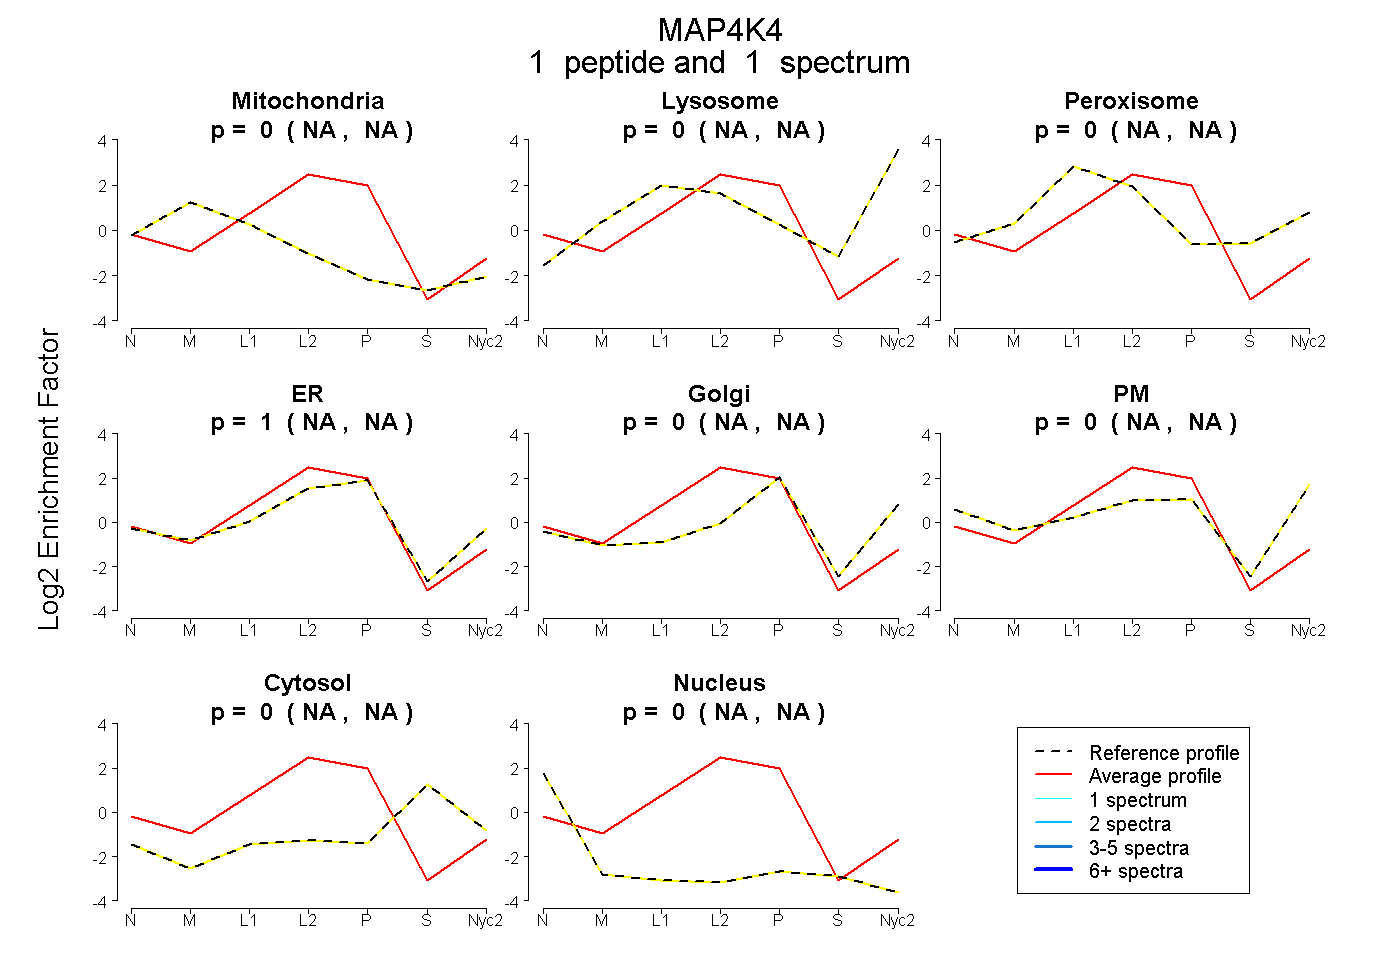
NA | NA
NA | NA
NA | NA
NA | NA
NA | NA
NA | NA
NA | NA
NA | NA
2peptides
spectra
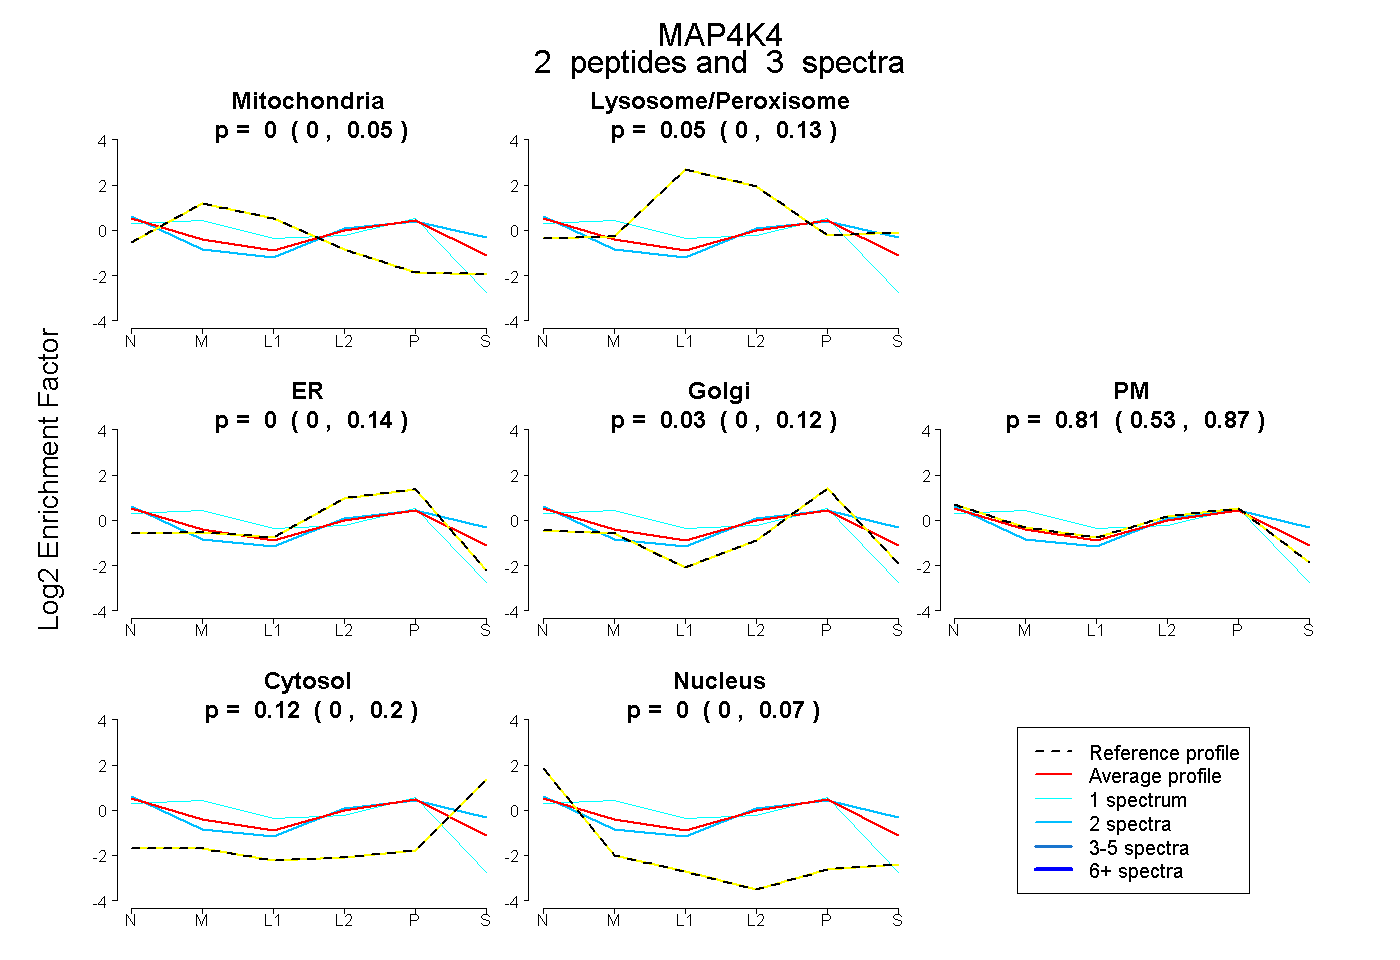
0.000 | 0.045
0.000 | 0.128
0.000 | 0.144
0.000 | 0.118
0.528 | 0.872
0.000 | 0.202
0.000 | 0.073
1peptide
spectrum
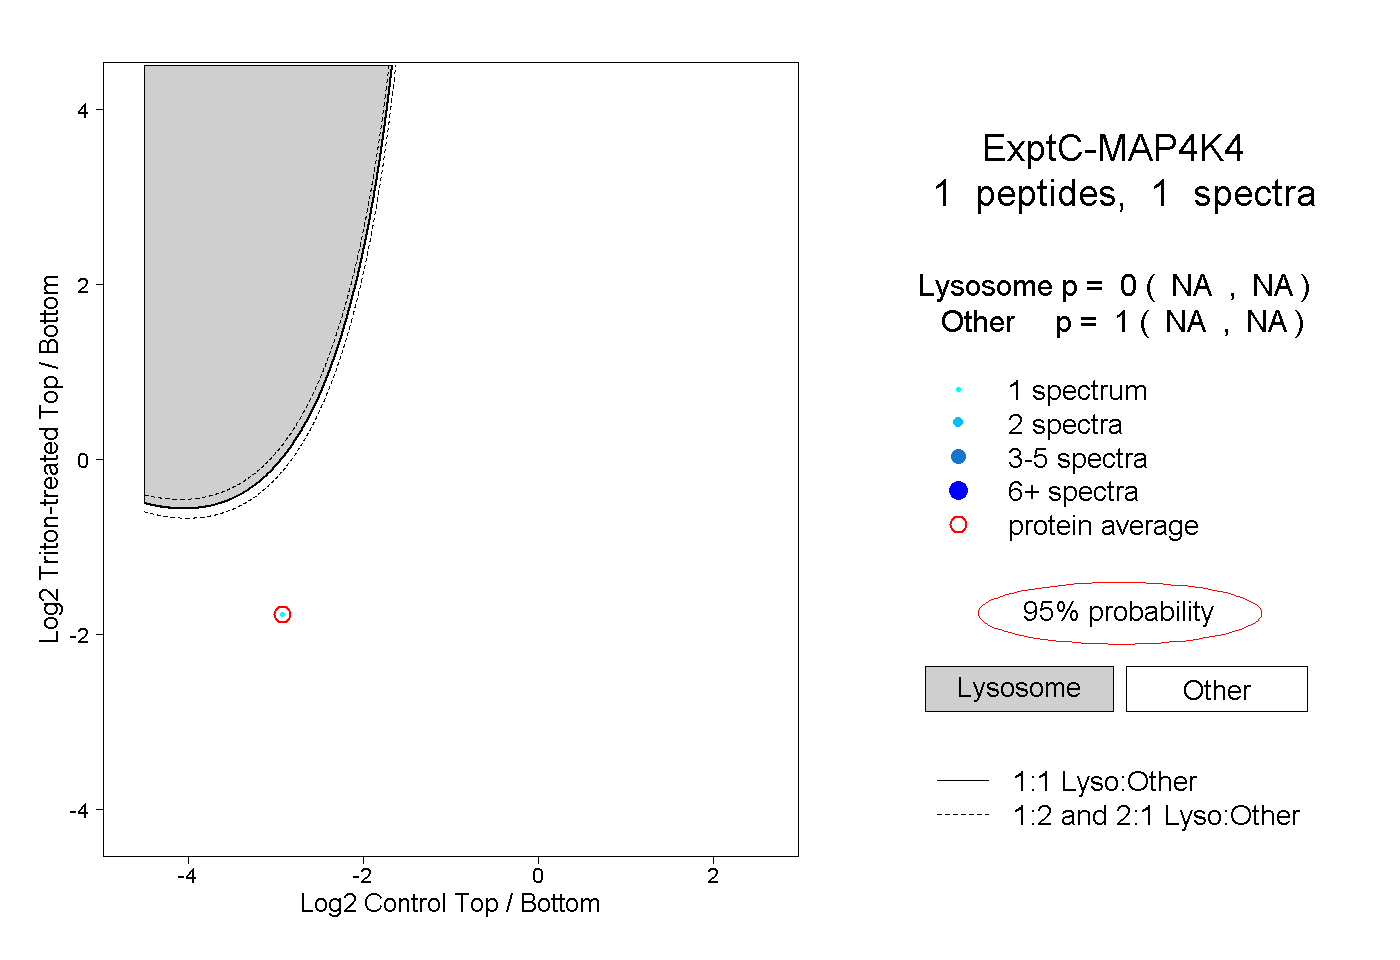
NA | NA
NA | NA
1peptide
spectrum
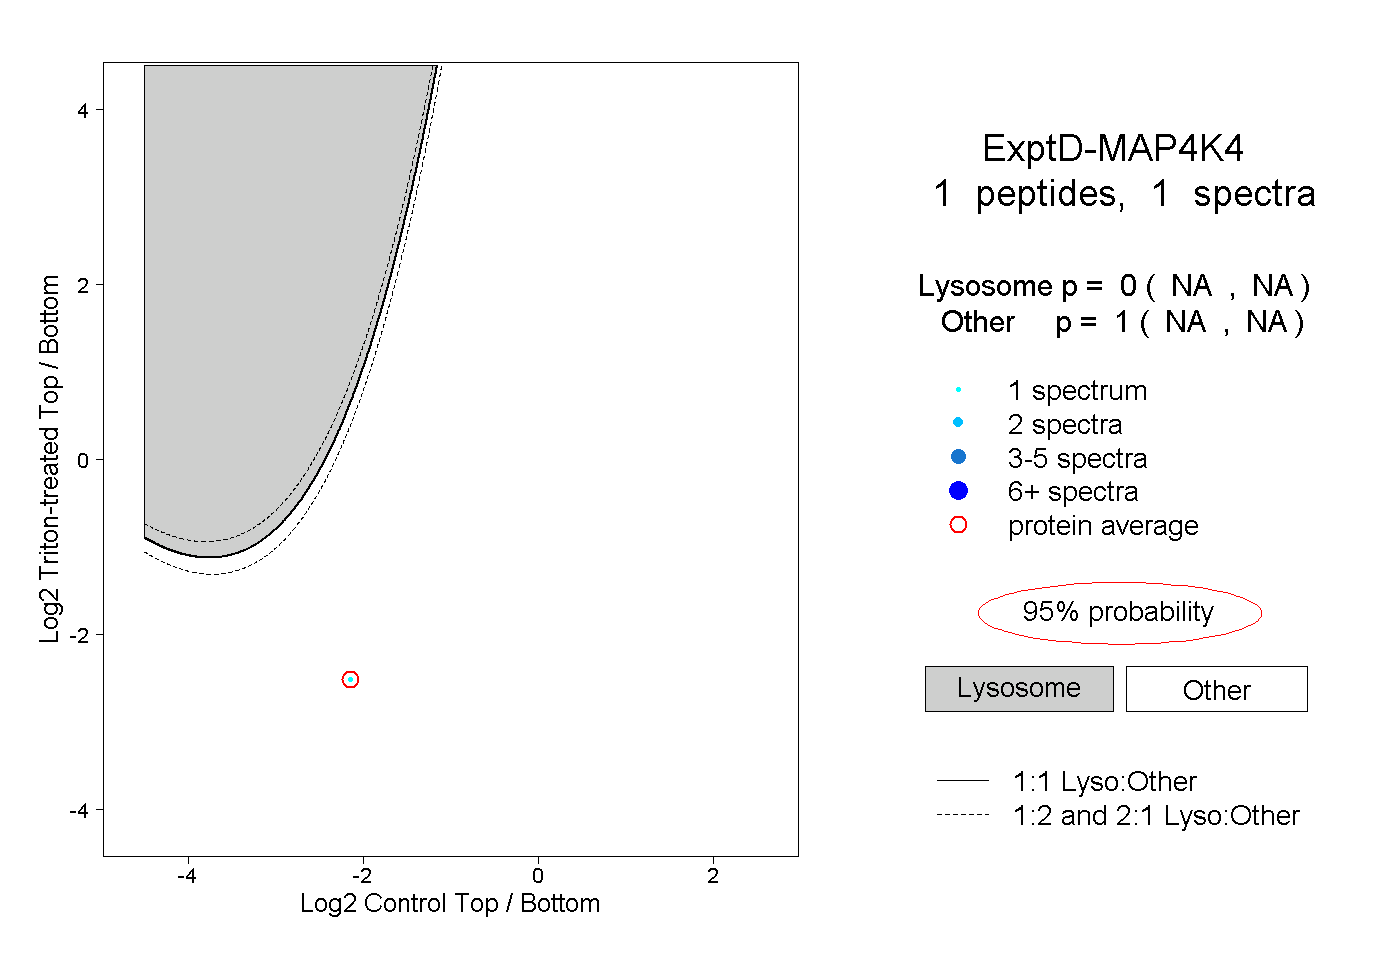
NA | NA
NA | NA