 7
7peptides
spectra
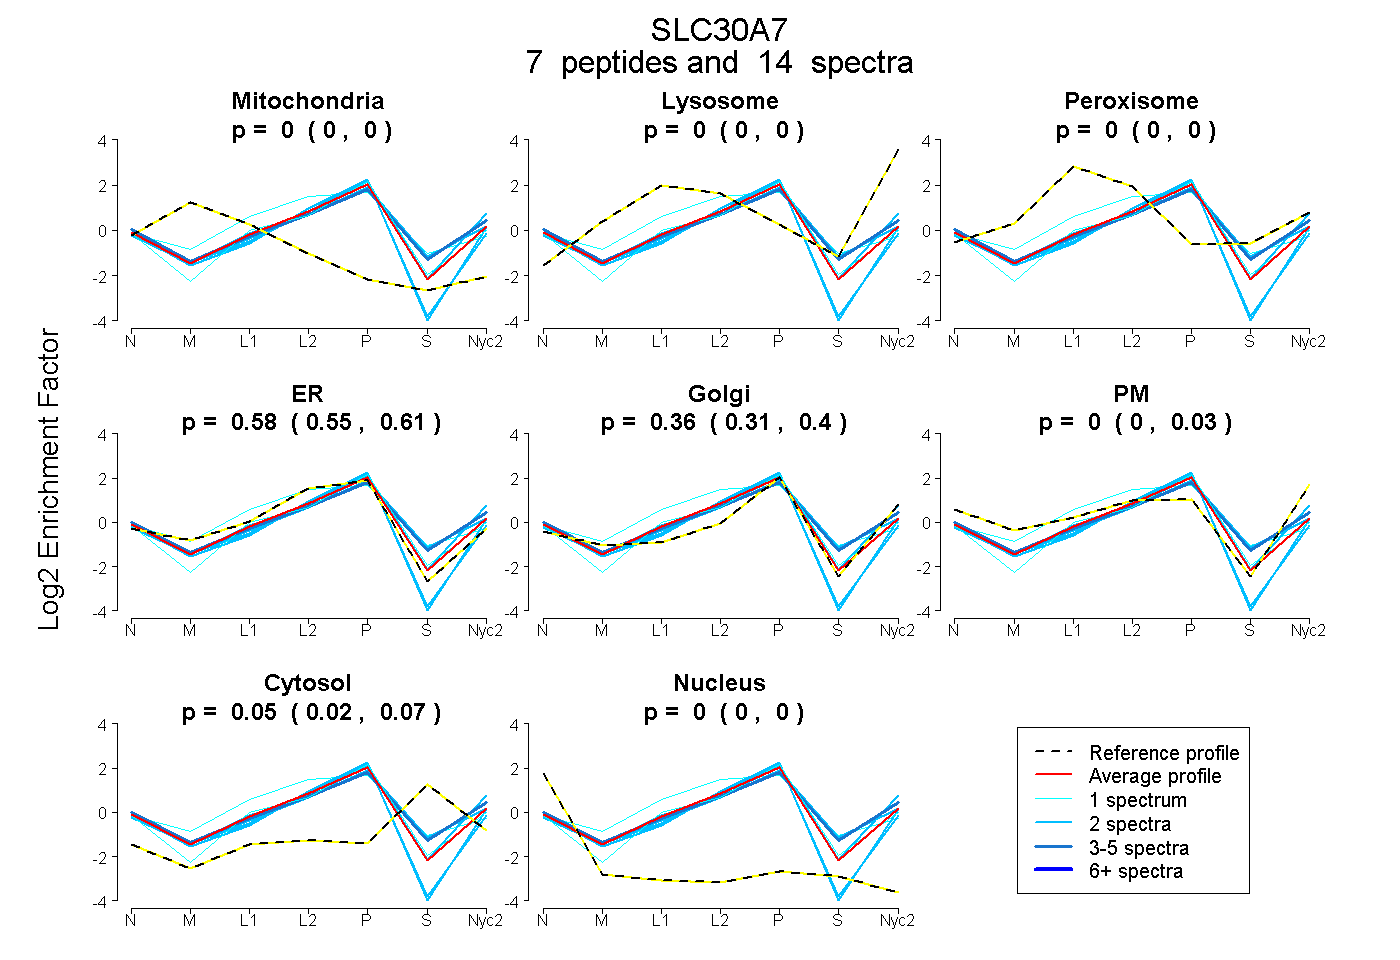
0.000 | 0.000
0.000 | 0.000
0.000 | 0.000
0.549 | 0.608
0.314 | 0.397
0.000 | 0.029
0.017 | 0.075
0.000 | 0.004
4peptides
spectra
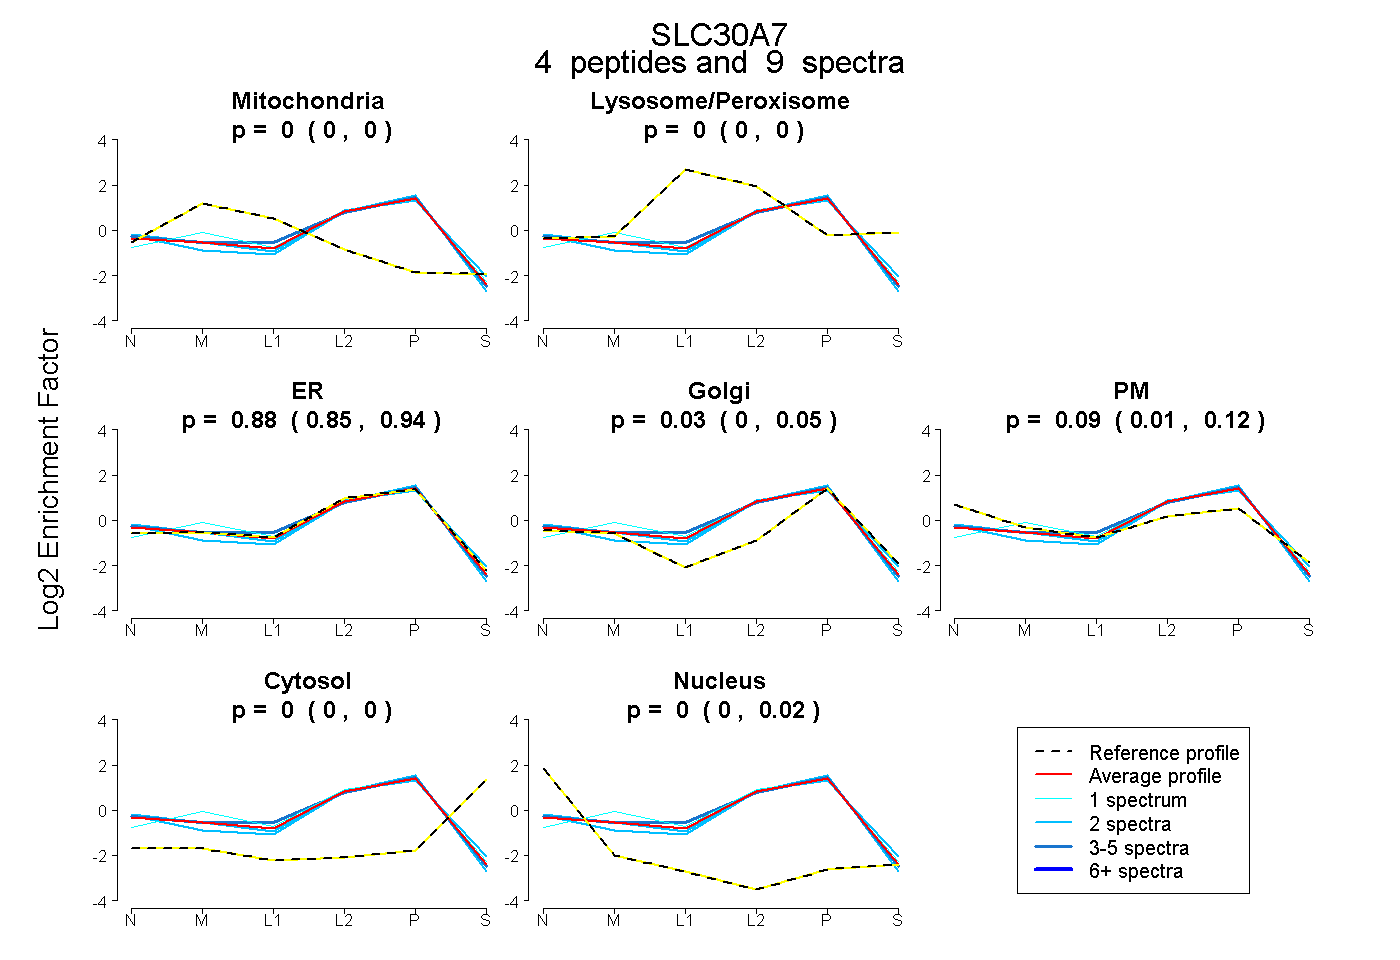
0.000 | 0.000
0.000 | 0.000
0.849 | 0.936
0.000 | 0.054
0.015 | 0.122
0.000 | 0.000
0.000 | 0.015
7peptides
spectra
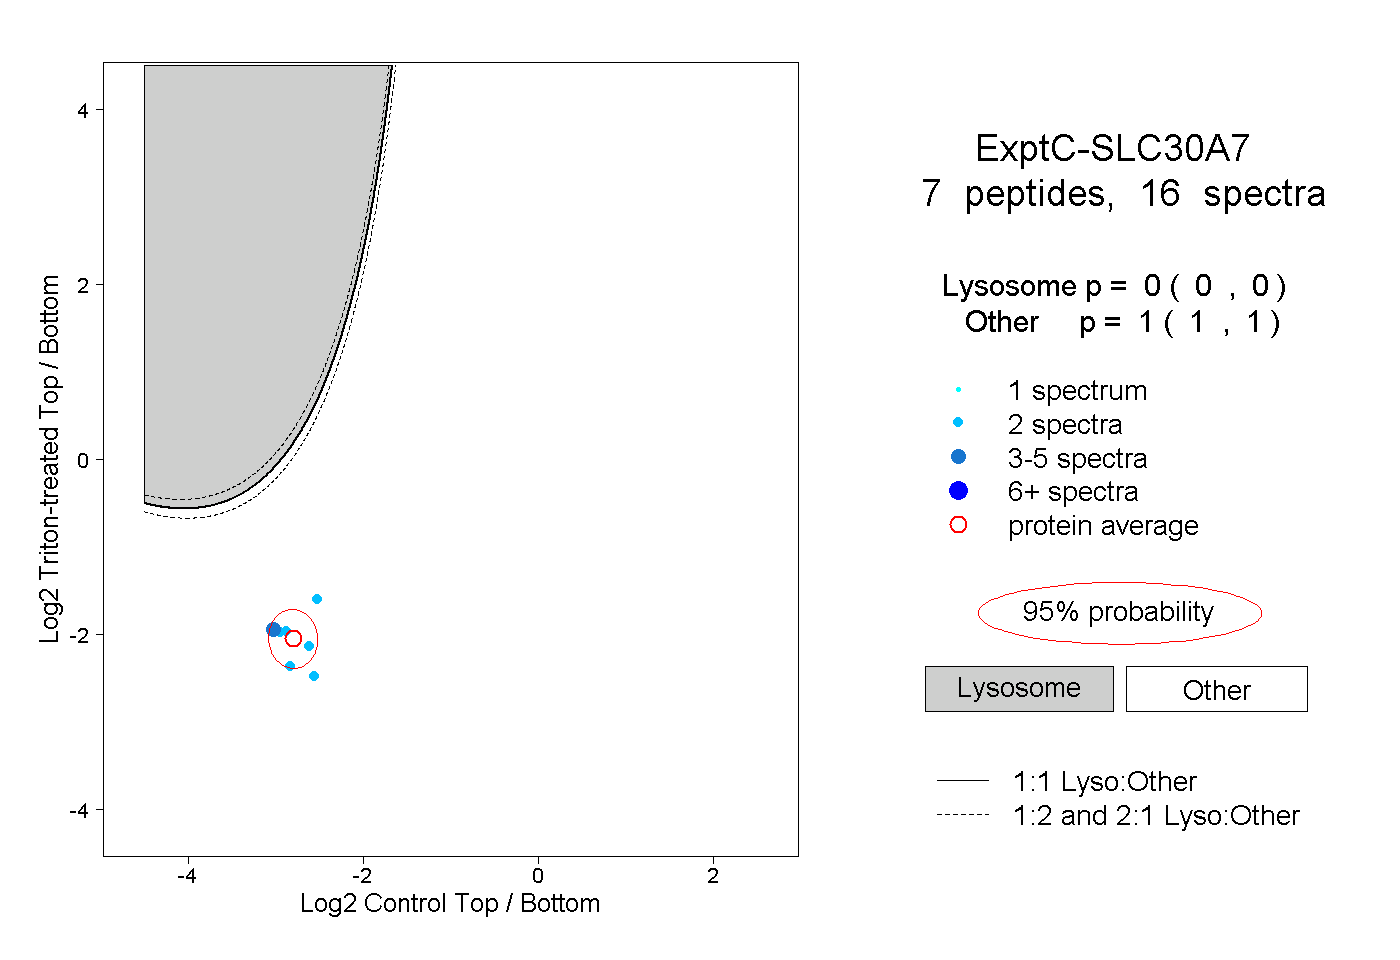
0.000 | 0.000
1.000 | 1.000
3peptides
spectra
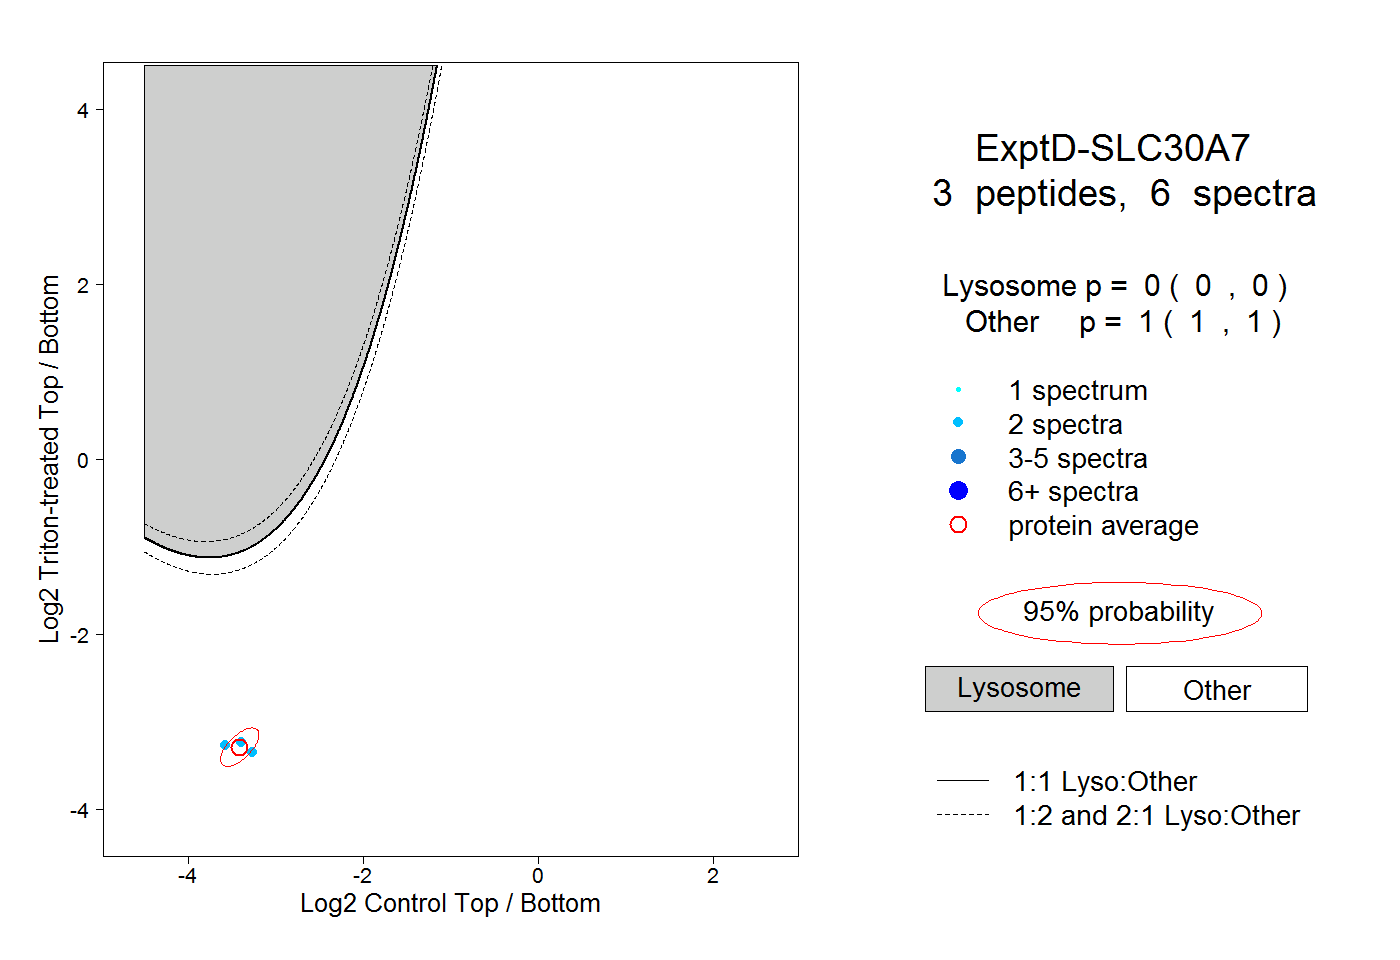
0.000 | 0.000
1.000 | 1.000