 23
23peptides
spectra
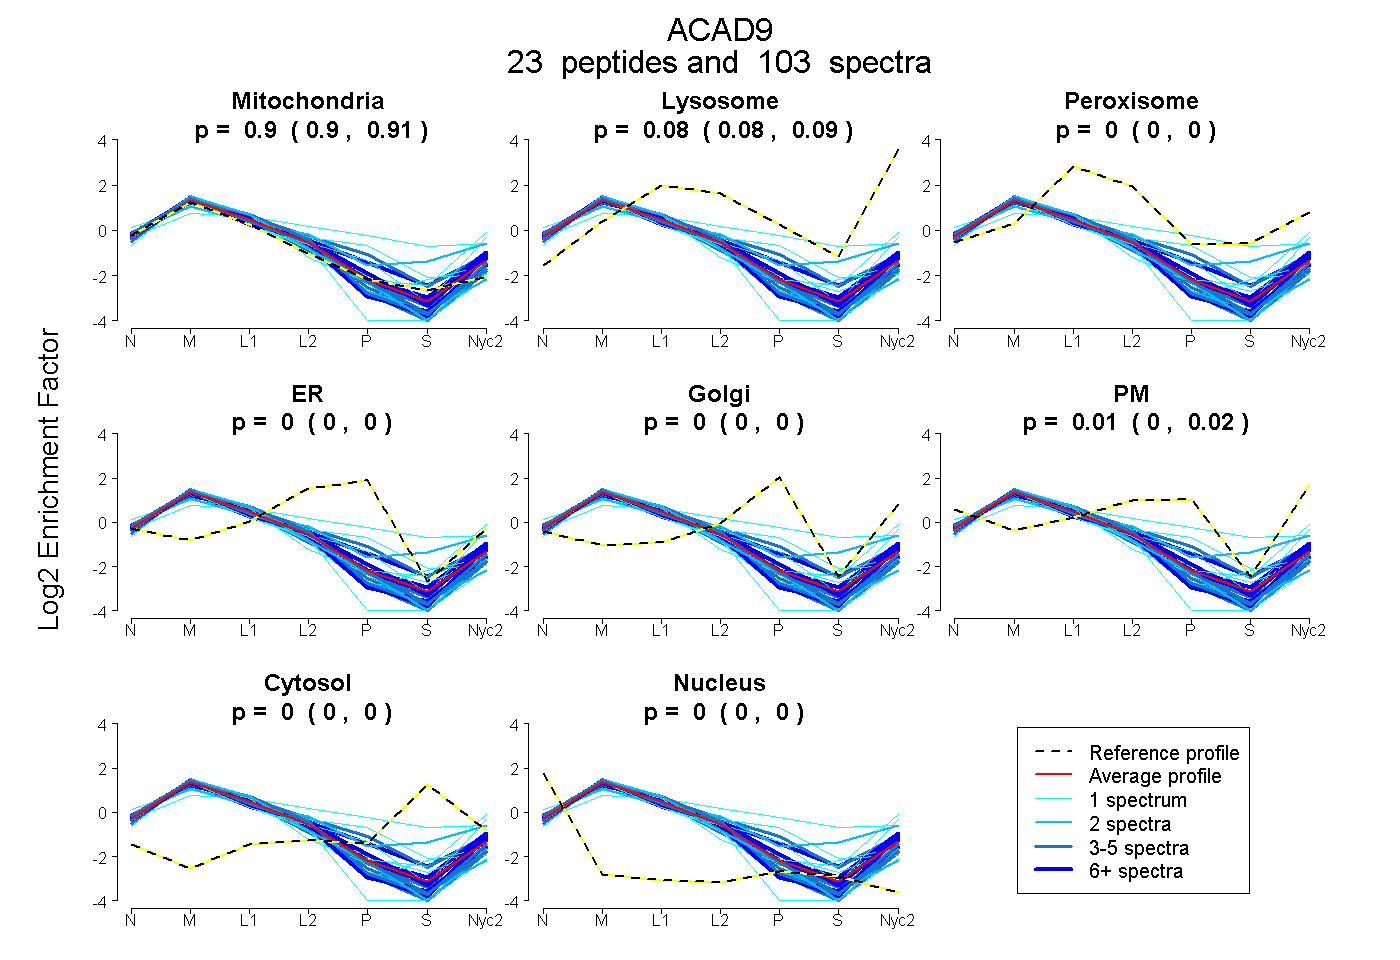
0.901 | 0.907
0.081 | 0.088
0.000 | 0.000
0.000 | 0.000
0.000 | 0.000
0.004 | 0.016
0.000 | 0.000
0.000 | 0.000
20peptides
spectra
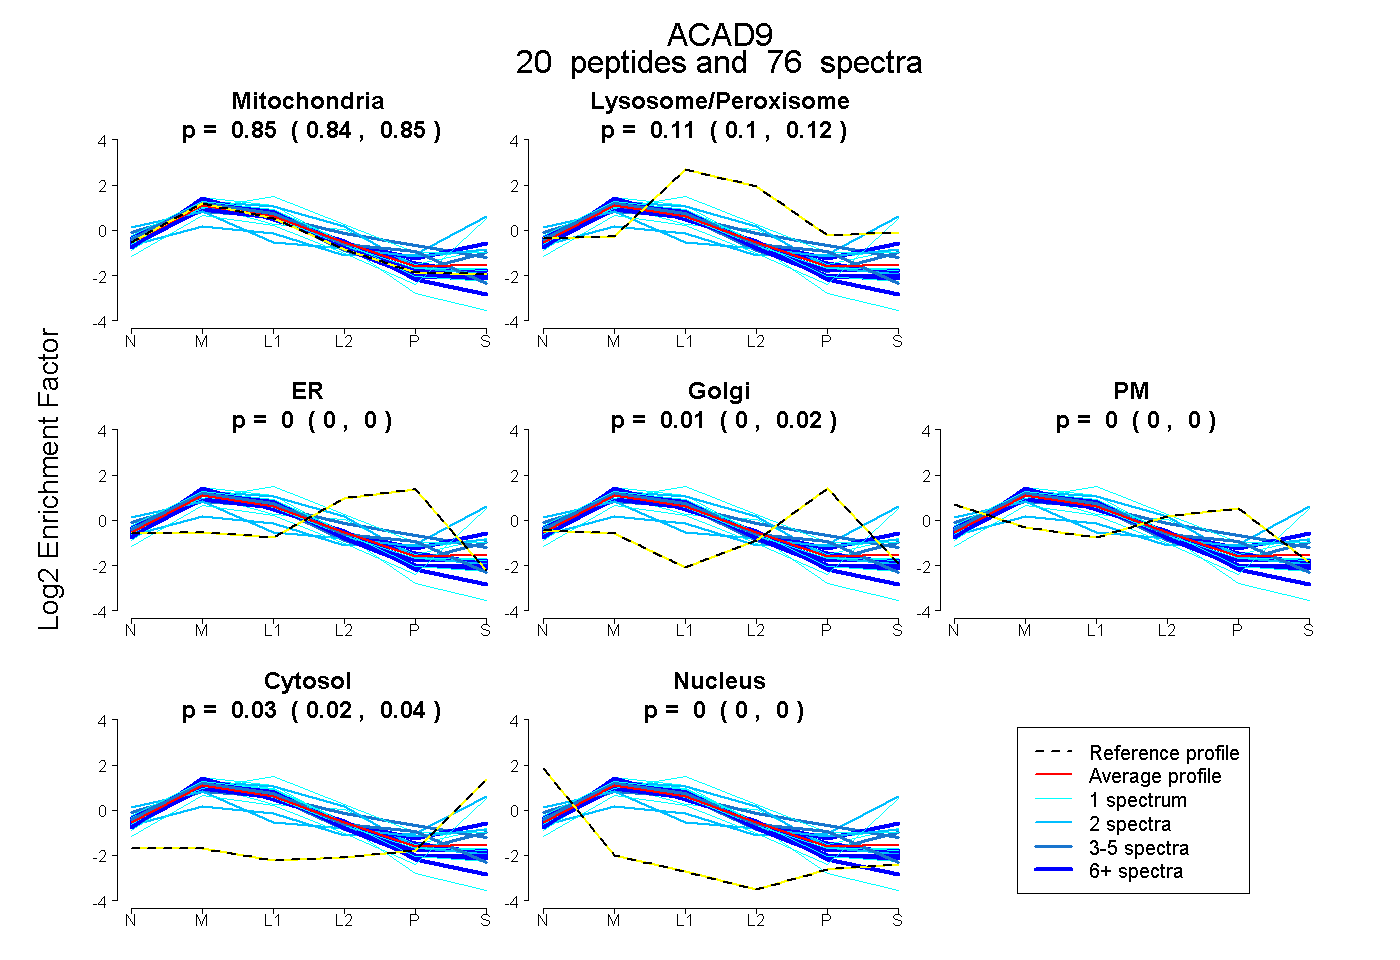
0.837 | 0.854
0.104 | 0.115
0.000 | 0.000
0.000 | 0.017
0.000 | 0.004
0.025 | 0.040
0.000 | 0.000
28peptides
spectra
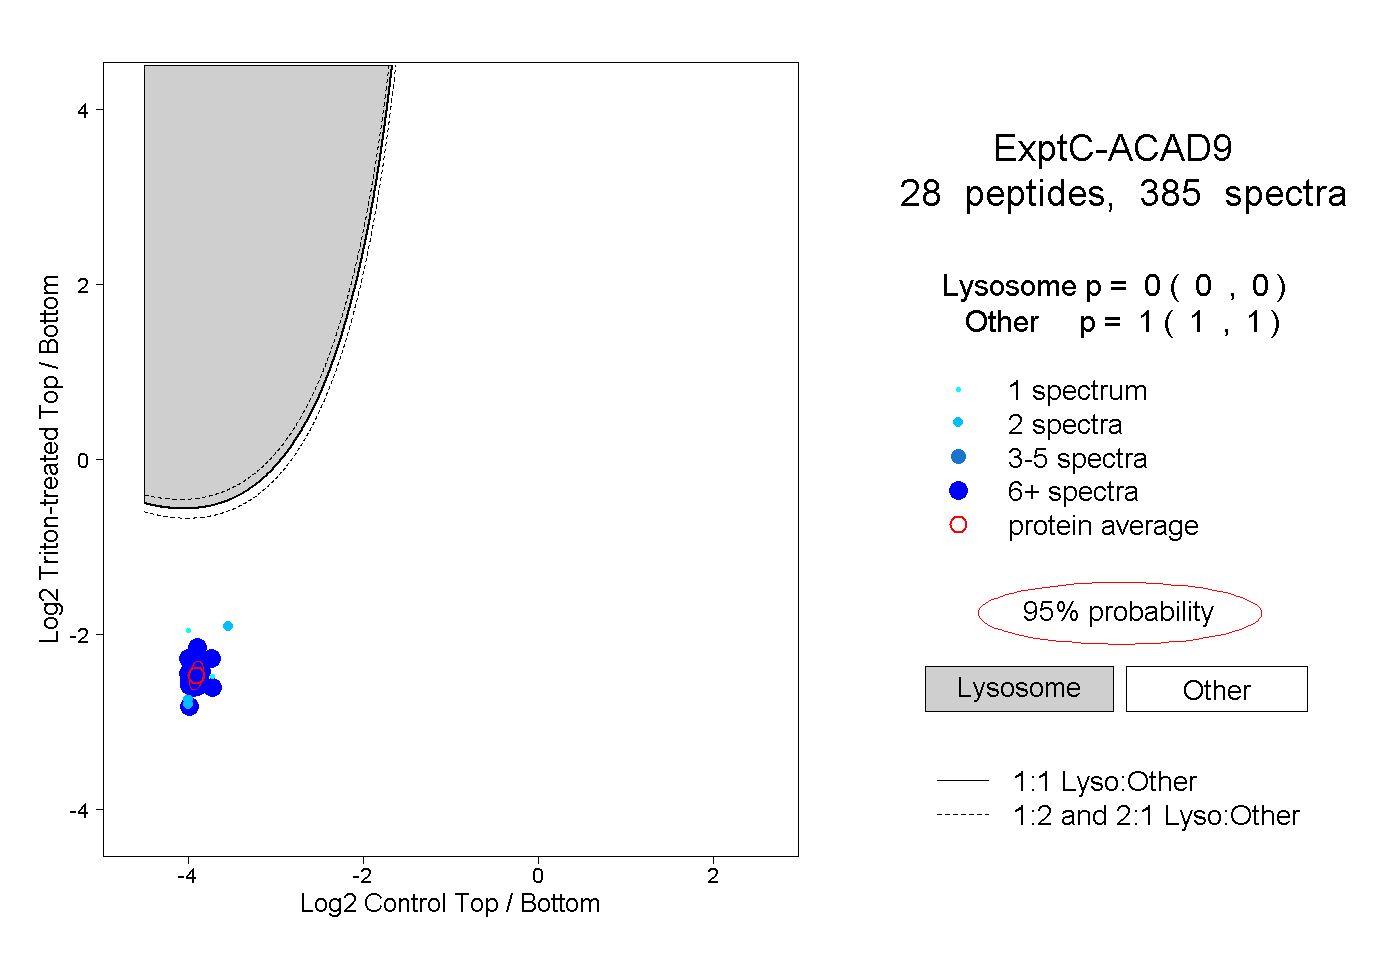
0.000 | 0.000
1.000 | 1.000
13peptides
spectra
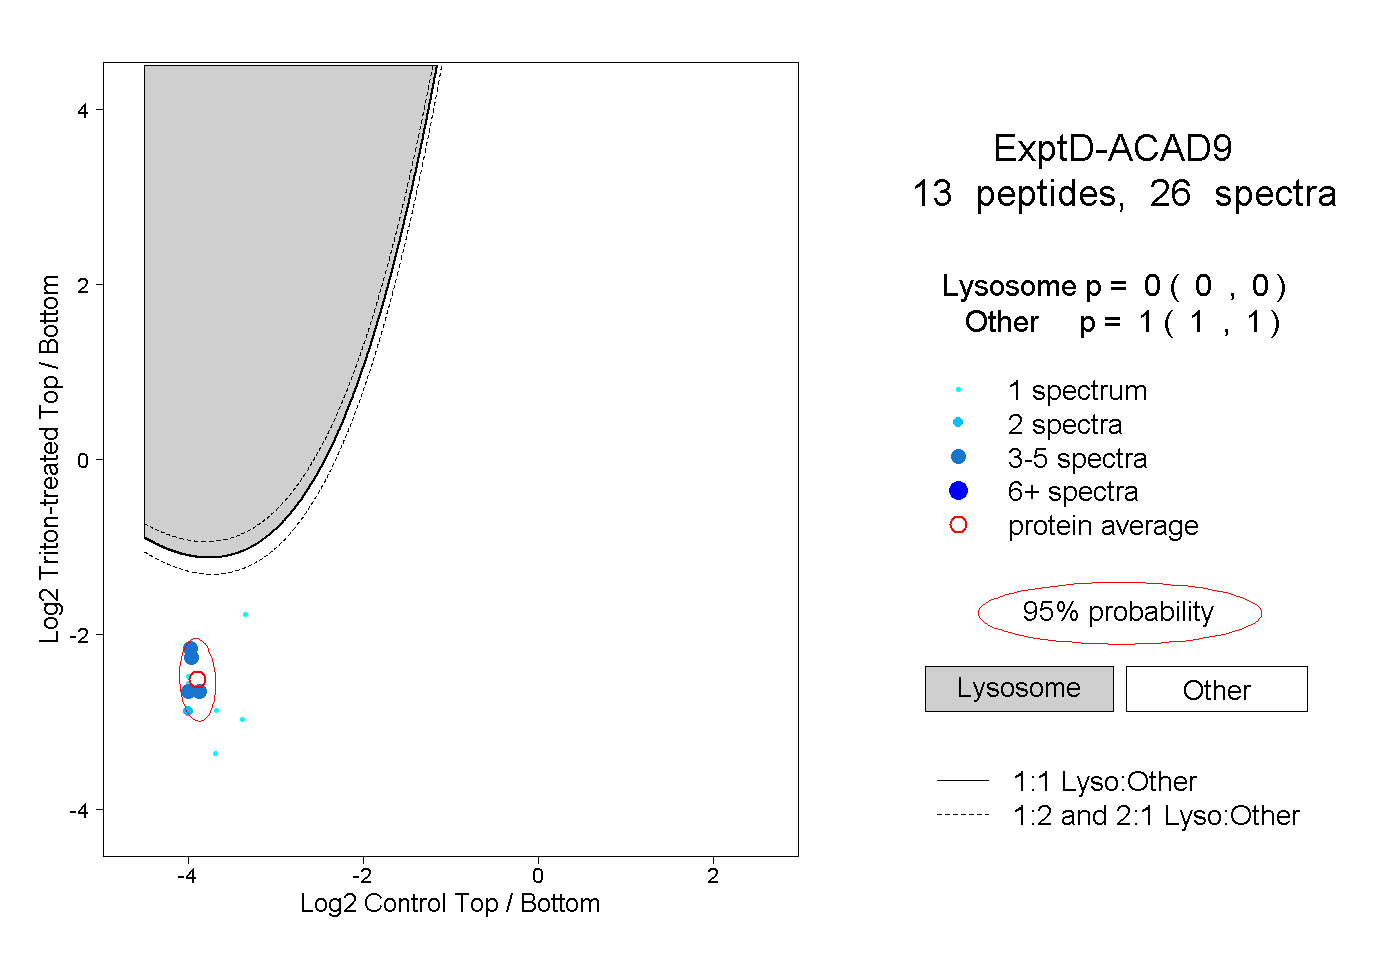
0.000 | 0.000
1.000 | 1.000