 23
23peptides
spectra
0.901 | 0.907
0.081 | 0.088
0.000 | 0.000
0.000 | 0.000
0.000 | 0.000
0.004 | 0.016
0.000 | 0.000
0.000 | 0.000
| Plot | Mito | Lyso | Perox | ER | Golgi | PM | Cytosol | Nucleus | |||||
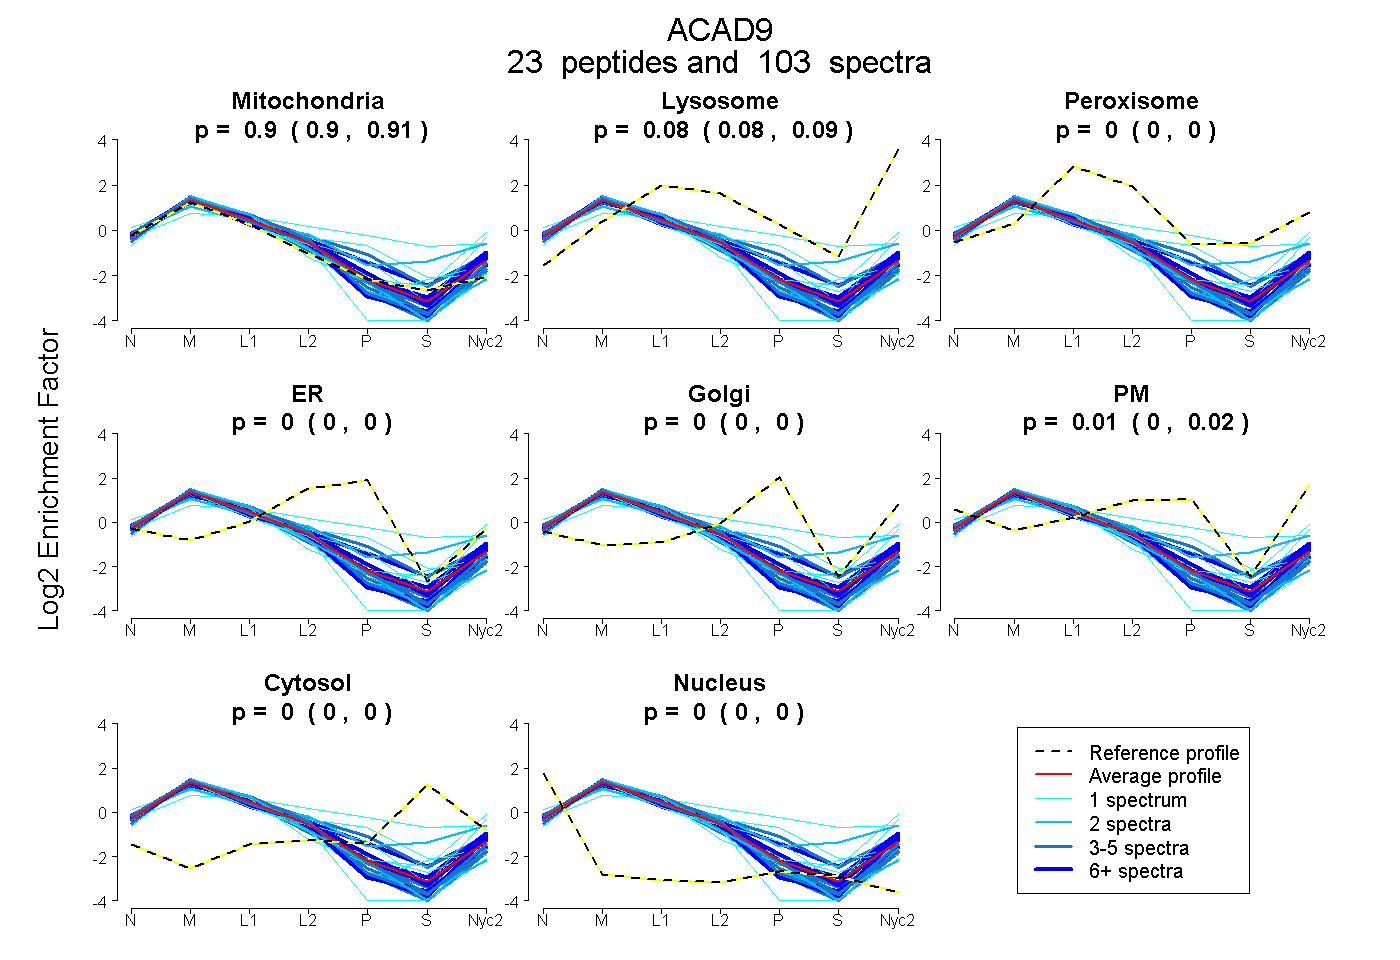
| Expt A |
23 peptides |
103 spectra |
|
0.904 0.901 | 0.907 |
0.085 0.081 | 0.088 |
0.000 0.000 | 0.000 |
0.000 0.000 | 0.000 |
0.000 0.000 | 0.000 |
0.011 0.004 | 0.016 |
0.000 0.000 | 0.000 |
0.000 0.000 | 0.000 |
| 2 spectra, LIEQTAEYACTR | 1.000 | 0.000 | 0.000 | 0.000 | 0.000 | 0.000 | 0.000 | 0.000 | ||
| 2 spectra, TEVVDSDGSIK | 0.609 | 0.115 | 0.136 | 0.000 | 0.000 | 0.040 | 0.100 | 0.000 | ||
| 1 spectrum, AYICAHPLDR | 0.329 | 0.000 | 0.375 | 0.000 | 0.175 | 0.000 | 0.121 | 0.000 | ||
| 3 spectra, YFVLNGSK | 0.960 | 0.000 | 0.000 | 0.000 | 0.000 | 0.040 | 0.000 | 0.000 | ||
| 8 spectra, TVETLLLR | 0.989 | 0.011 | 0.000 | 0.000 | 0.000 | 0.000 | 0.000 | 0.000 | ||
| 1 spectrum, NLSEFGLIQEK | 0.700 | 0.109 | 0.000 | 0.000 | 0.000 | 0.191 | 0.000 | 0.000 | ||
| 1 spectrum, LEENVHYFGR | 0.927 | 0.016 | 0.039 | 0.000 | 0.000 | 0.000 | 0.018 | 0.000 | ||
| 2 spectra, YAPENLDEQIK | 0.977 | 0.023 | 0.000 | 0.000 | 0.000 | 0.000 | 0.000 | 0.000 | ||
| 19 spectra, VAMNILNSGR | 0.897 | 0.088 | 0.000 | 0.000 | 0.000 | 0.015 | 0.000 | 0.000 | ||
| 1 spectrum, IPADTLAK | 1.000 | 0.000 | 0.000 | 0.000 | 0.000 | 0.000 | 0.000 | 0.000 | ||
| 8 spectra, MTAFIVER | 0.840 | 0.079 | 0.000 | 0.000 | 0.000 | 0.081 | 0.000 | 0.000 | ||
| 6 spectra, DYPYER | 0.755 | 0.035 | 0.087 | 0.000 | 0.000 | 0.123 | 0.000 | 0.000 | ||
| 3 spectra, GIILVGNEEQK | 0.991 | 0.005 | 0.000 | 0.000 | 0.000 | 0.003 | 0.000 | 0.000 | ||
| 9 spectra, SGNVTTVMETIGR | 0.935 | 0.065 | 0.000 | 0.000 | 0.000 | 0.000 | 0.000 | 0.000 | ||
| 1 spectrum, GSNTCEVHFENTR | 0.693 | 0.000 | 0.084 | 0.223 | 0.000 | 0.000 | 0.000 | 0.000 | ||
| 1 spectrum, TIVEEQLVLK | 0.990 | 0.000 | 0.000 | 0.000 | 0.000 | 0.010 | 0.000 | 0.000 | ||
| 17 spectra, FFNEEVDSR | 0.863 | 0.123 | 0.000 | 0.000 | 0.000 | 0.014 | 0.000 | 0.000 | ||
| 5 spectra, FALMAQK | 0.952 | 0.048 | 0.000 | 0.000 | 0.000 | 0.000 | 0.000 | 0.000 | ||
| 4 spectra, ELFLGHIQQK | 0.717 | 0.122 | 0.023 | 0.133 | 0.000 | 0.006 | 0.000 | 0.000 | ||
| 1 spectrum, ILLIFEGTNEILR | 0.941 | 0.056 | 0.000 | 0.000 | 0.000 | 0.003 | 0.000 | 0.000 | ||
| 4 spectra, FSMGSAVAGMLK | 1.000 | 0.000 | 0.000 | 0.000 | 0.000 | 0.000 | 0.000 | 0.000 | ||
| 1 spectrum, VSQQILEK | 0.739 | 0.244 | 0.000 | 0.000 | 0.000 | 0.000 | 0.000 | 0.017 | ||
| 3 spectra, VPVENVLGEVGGGFK | 0.953 | 0.047 | 0.000 | 0.000 | 0.000 | 0.000 | 0.000 | 0.000 |
| Plot | Mito | Lyso or Perox | ER | Golgi | PM | Cytosol | Nucleus | ||||||
| Expt B |
20 peptides |
76 spectra |
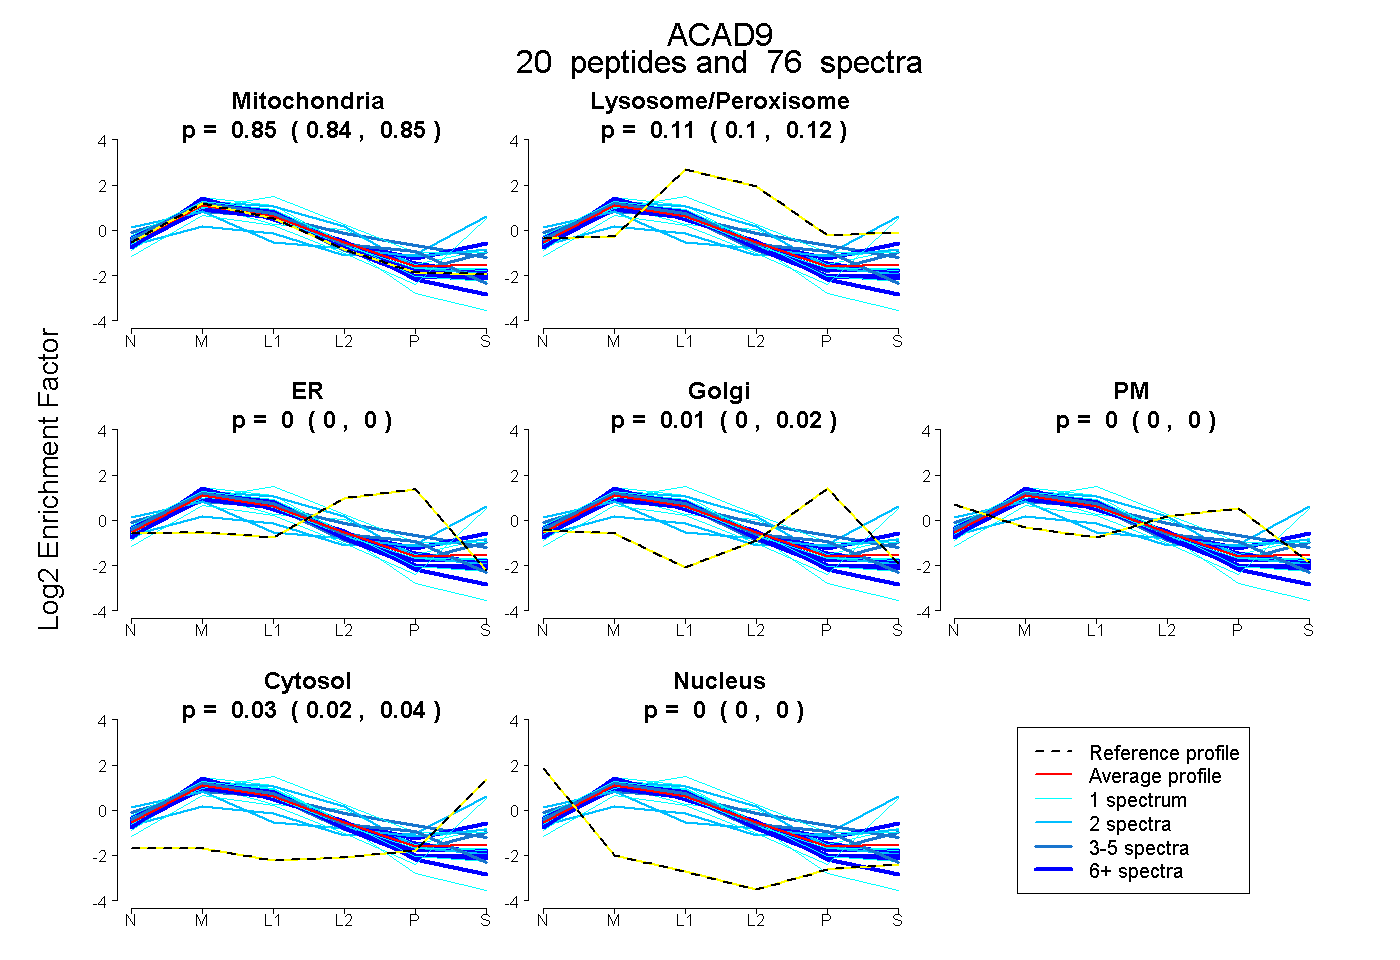 |
0.846 0.837 | 0.854 |
0.110 0.104 | 0.115 |
0.000 0.000 | 0.000 |
0.010 0.000 | 0.017 |
0.000 0.000 | 0.004 |
0.033 0.025 | 0.040 |
0.000 0.000 | 0.000 |
|||
| Plot | Lyso | Other | |||||||||||
| Expt C |
28 peptides |
385 spectra |
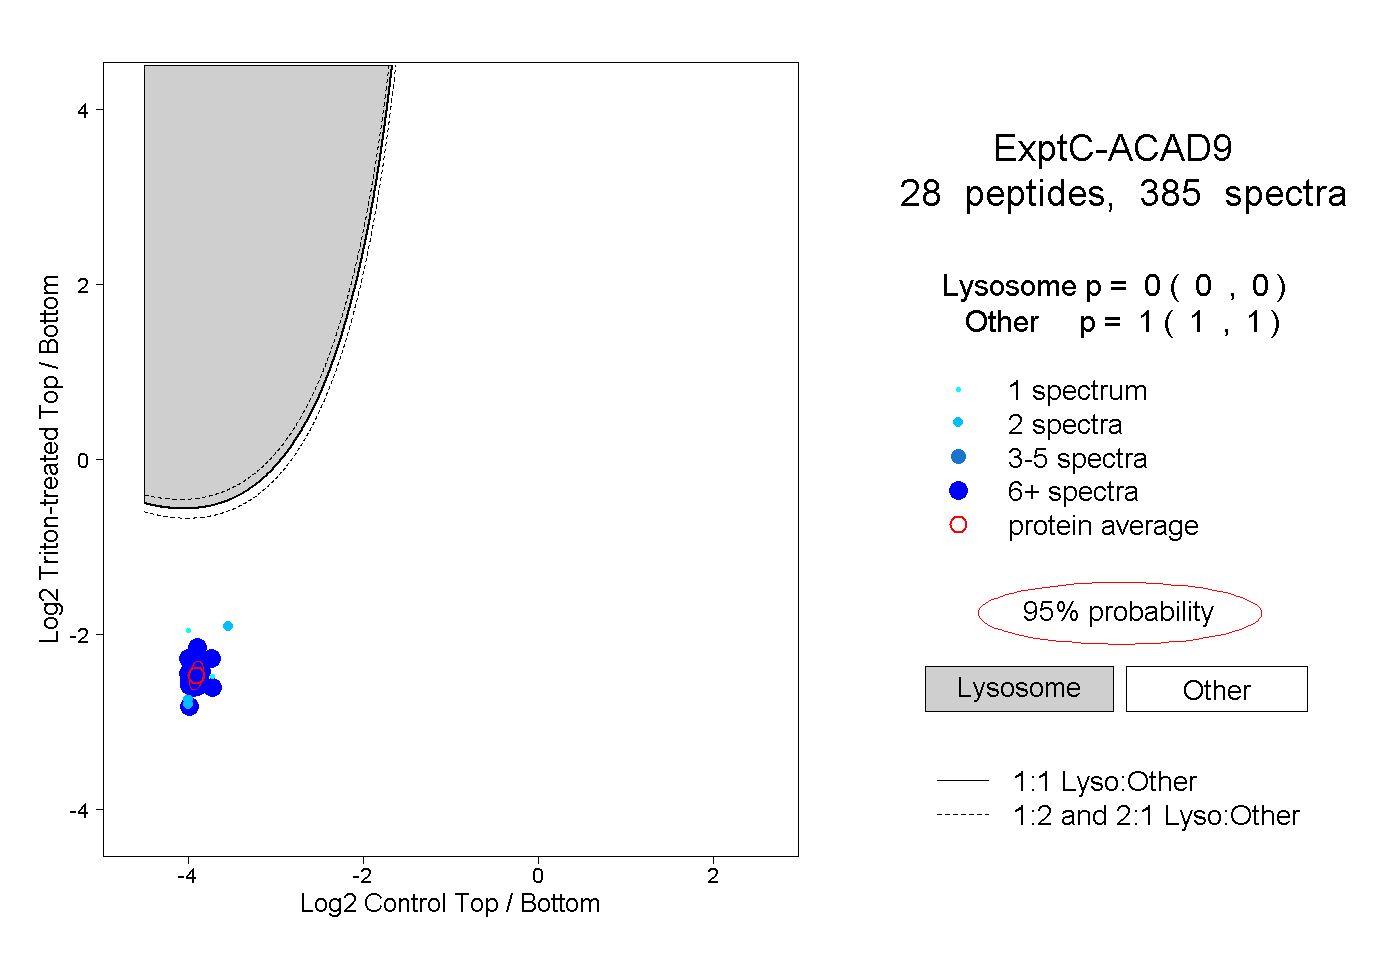 |
0.000 0.000 | 0.000 |
1.000 1.000 | 1.000 |
||||||||
| Plot | Lyso | Other | |||||||||||
| Expt D |
13 peptides |
26 spectra |
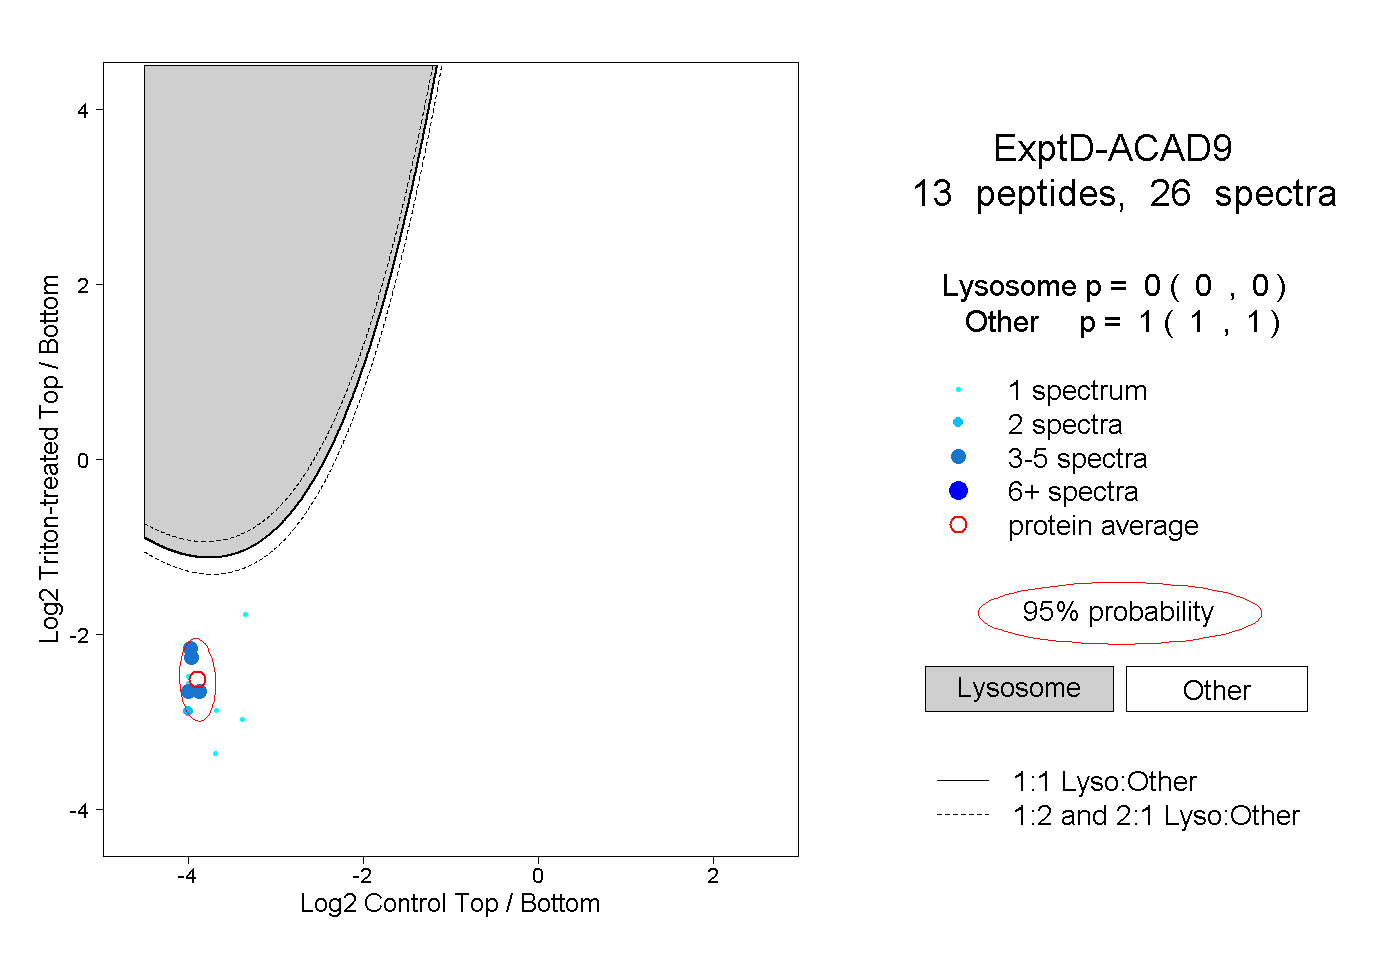 |
0.000 0.000 | 0.000 |
1.000 1.000 | 1.000 |