 8
8peptides
spectra
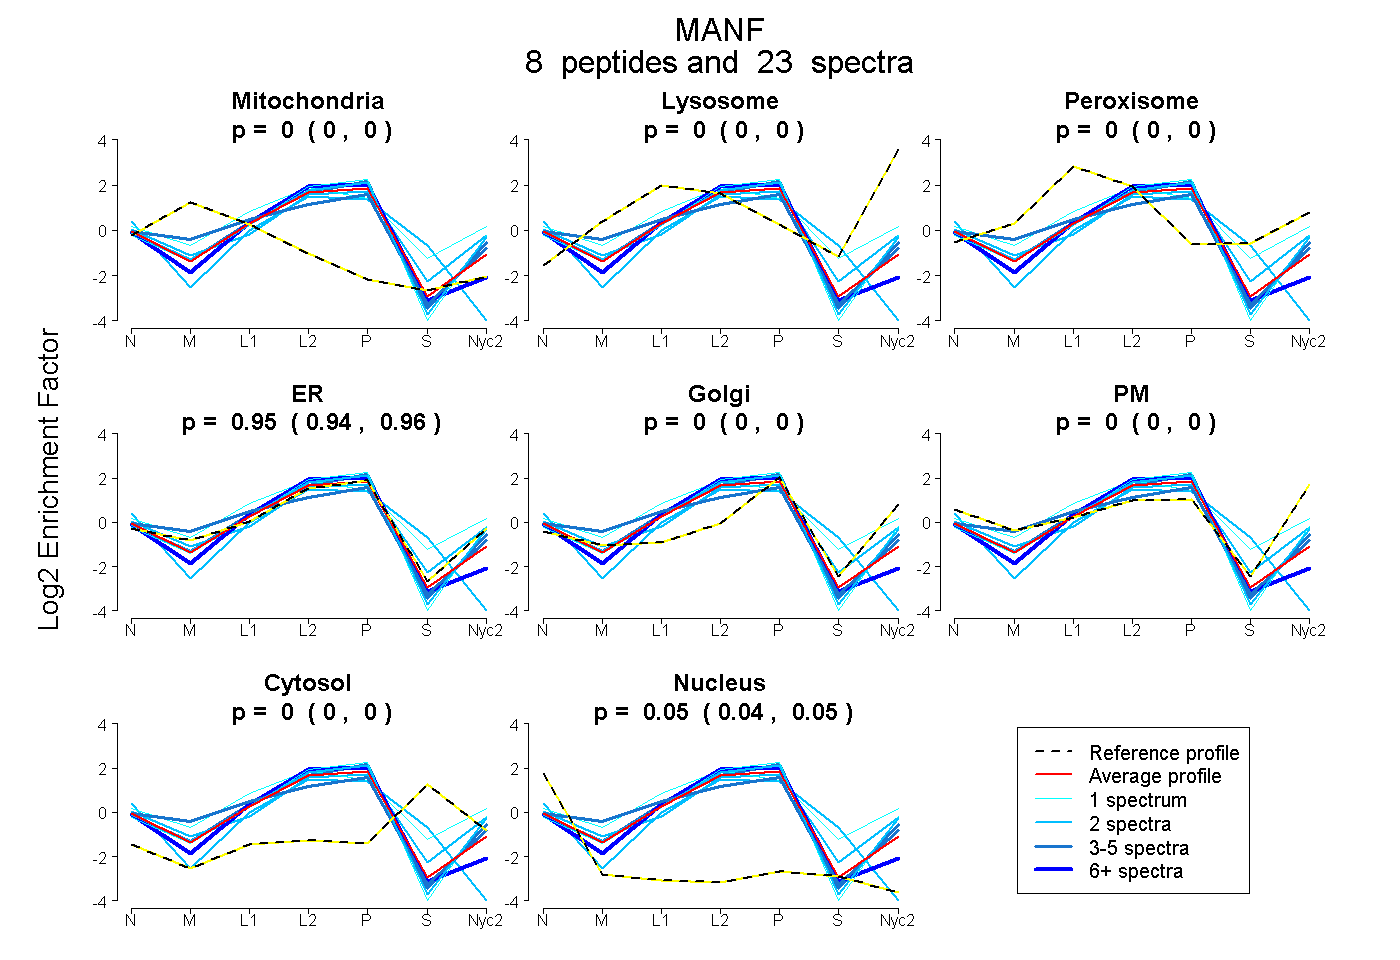
0.000 | 0.000
0.000 | 0.000
0.000 | 0.000
0.943 | 0.962
0.000 | 0.000
0.000 | 0.000
0.000 | 0.000
0.036 | 0.055
4peptides
spectra
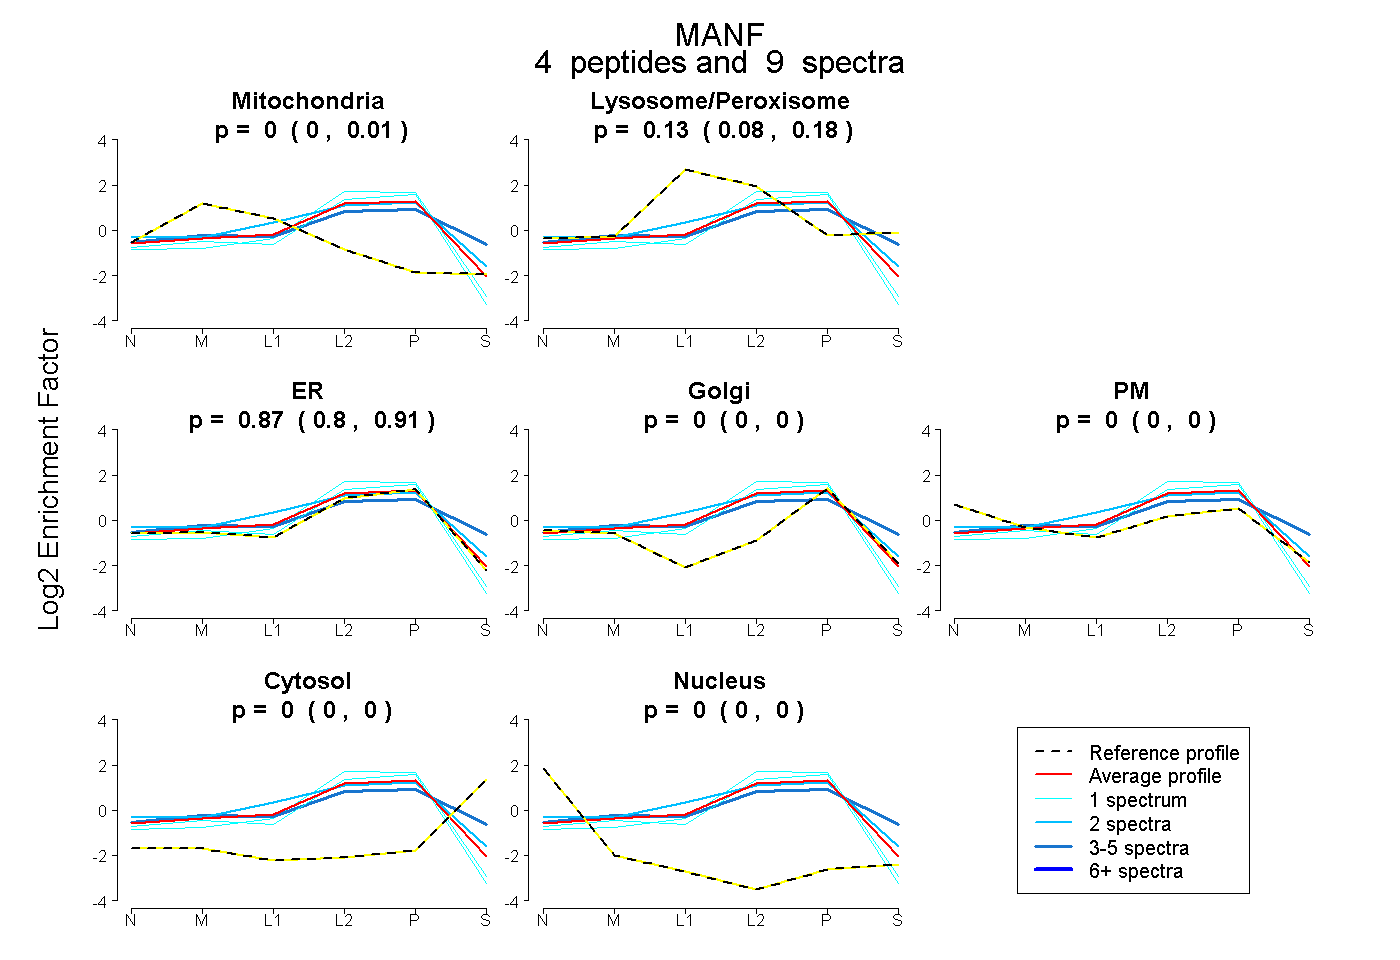
0.000 | 0.010
0.079 | 0.176
0.803 | 0.910
0.000 | 0.000
0.000 | 0.000
0.000 | 0.000
0.000 | 0.000
7peptides
spectra
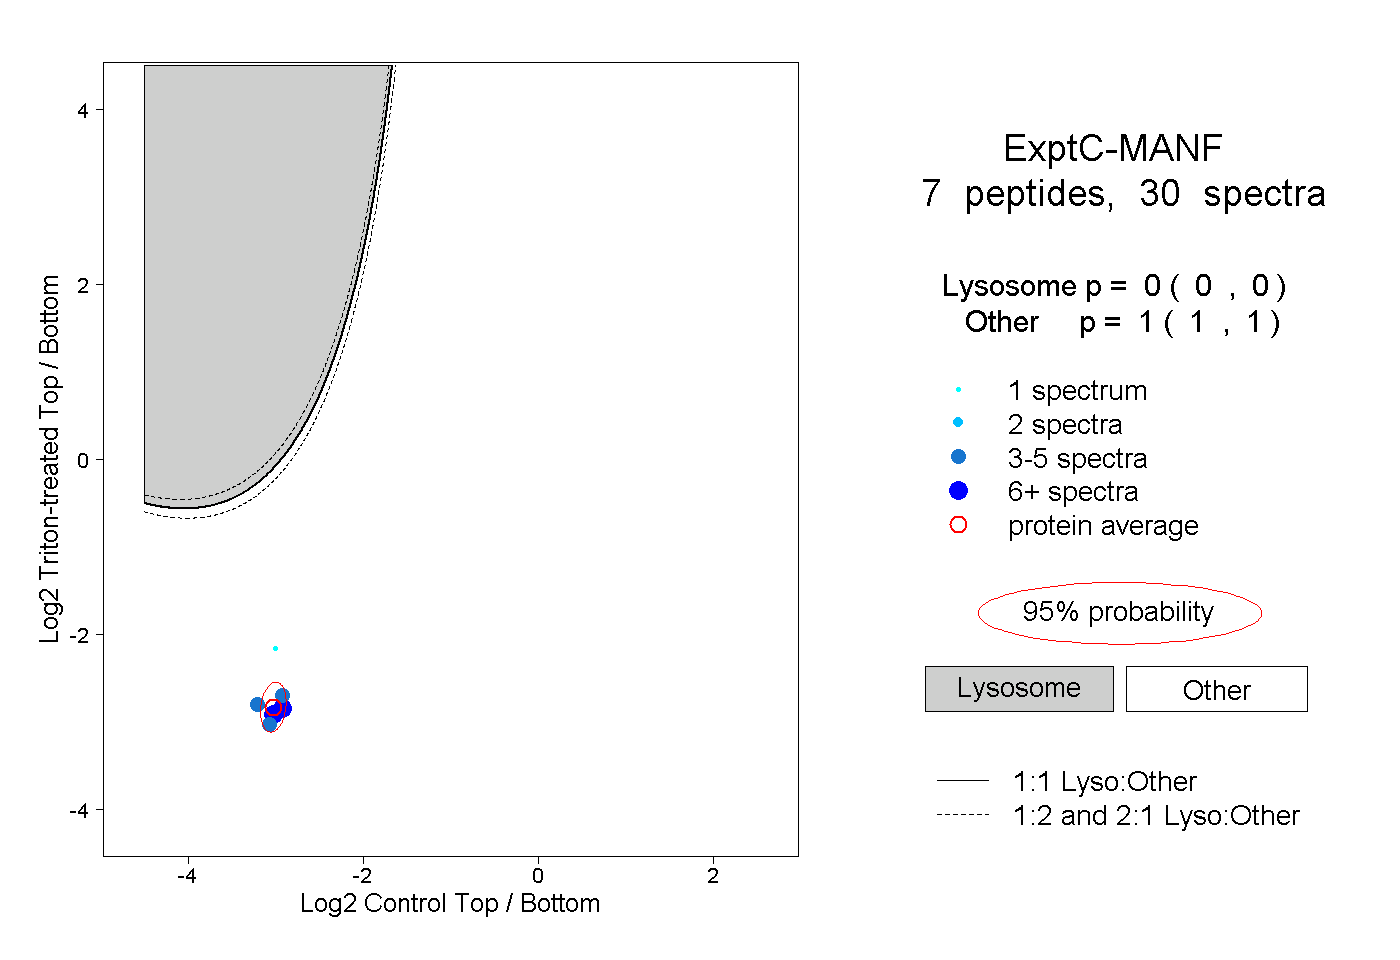
0.000 | 0.000
1.000 | 1.000
3peptides
spectra
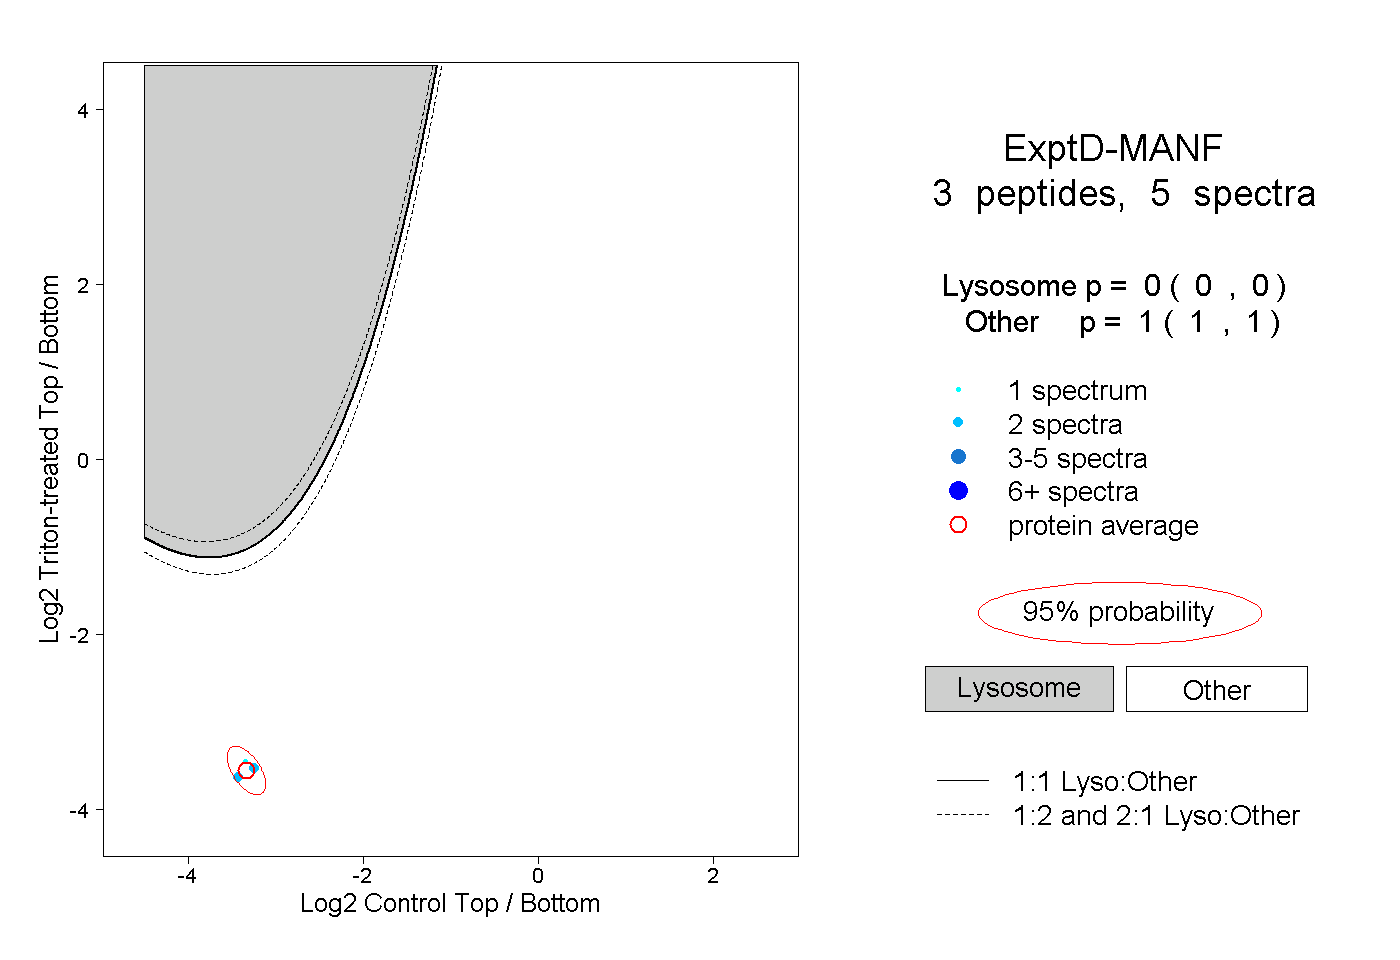
0.000 | 0.000
1.000 | 1.000