 3
3peptides
spectra
0.000 | 0.061
0.000 | 0.000
0.000 | 0.000
0.054 | 0.341
0.000 | 0.297
0.000 | 0.000
0.392 | 0.470
0.137 | 0.223
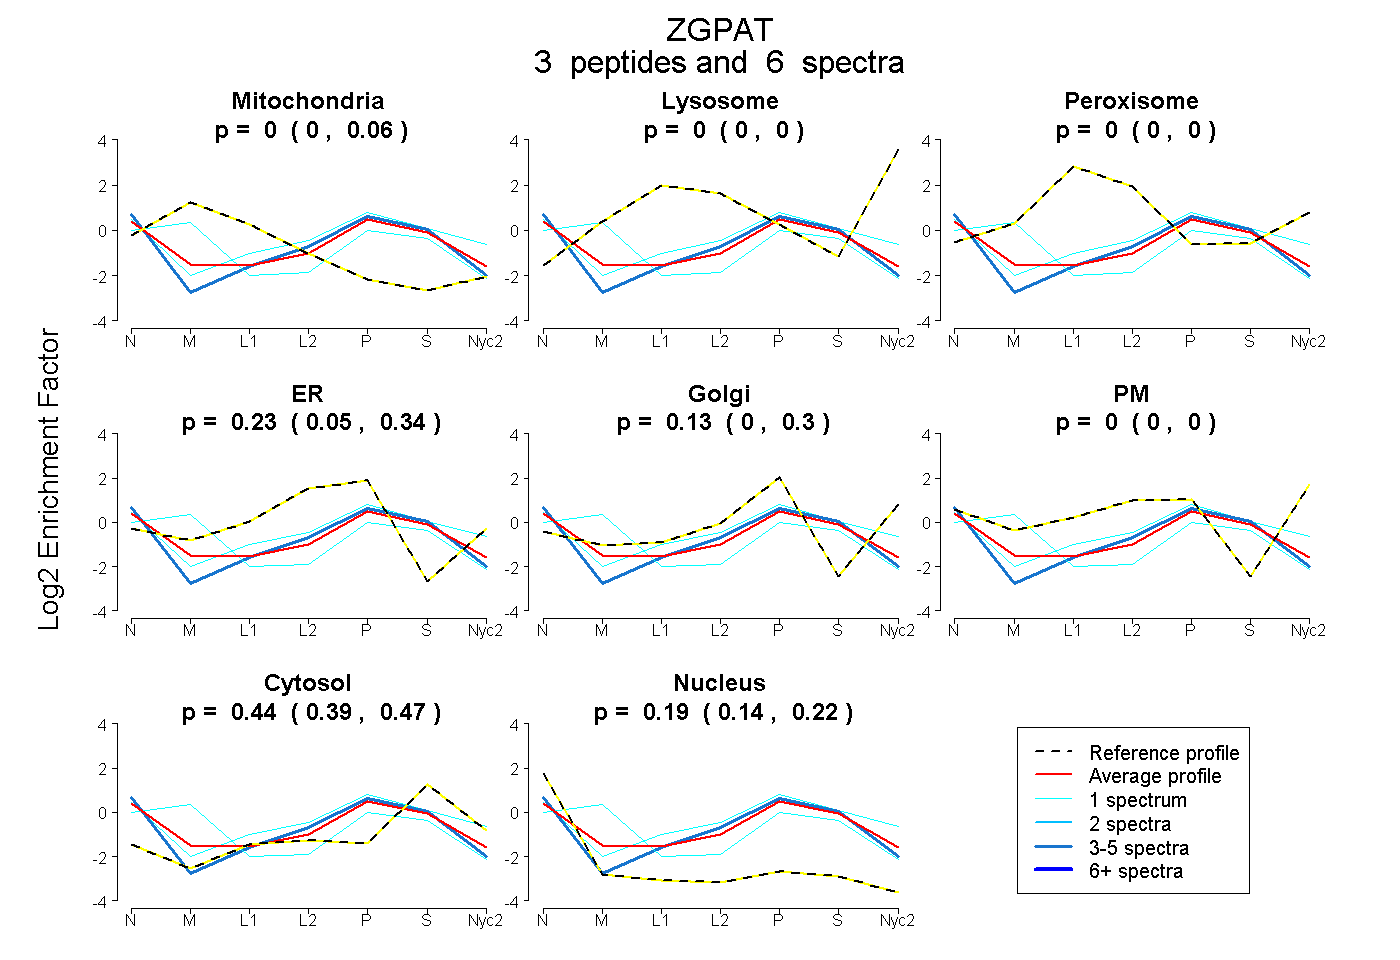
| Plot | Mito | Lyso | Perox | ER | Golgi | PM | Cytosol | Nucleus | |||||
| Expt A |
3 peptides |
6 spectra |
|
0.000 0.000 | 0.061 |
0.000 0.000 | 0.000 |
0.000 0.000 | 0.000 |
0.234 0.054 | 0.341 |
0.135 0.000 | 0.297 |
0.000 0.000 | 0.000 |
0.439 0.392 | 0.470 |
0.192 0.137 | 0.223 |