CES2H
[ENSRNOP00000019072]
Main page
| | | Plot |
Mito |
Lyso |
|
Perox |
ER |
Golgi |
PM |
Cytosol |
Nucleus |
|
| Expt A |
 13
13
peptides |
49
spectra |
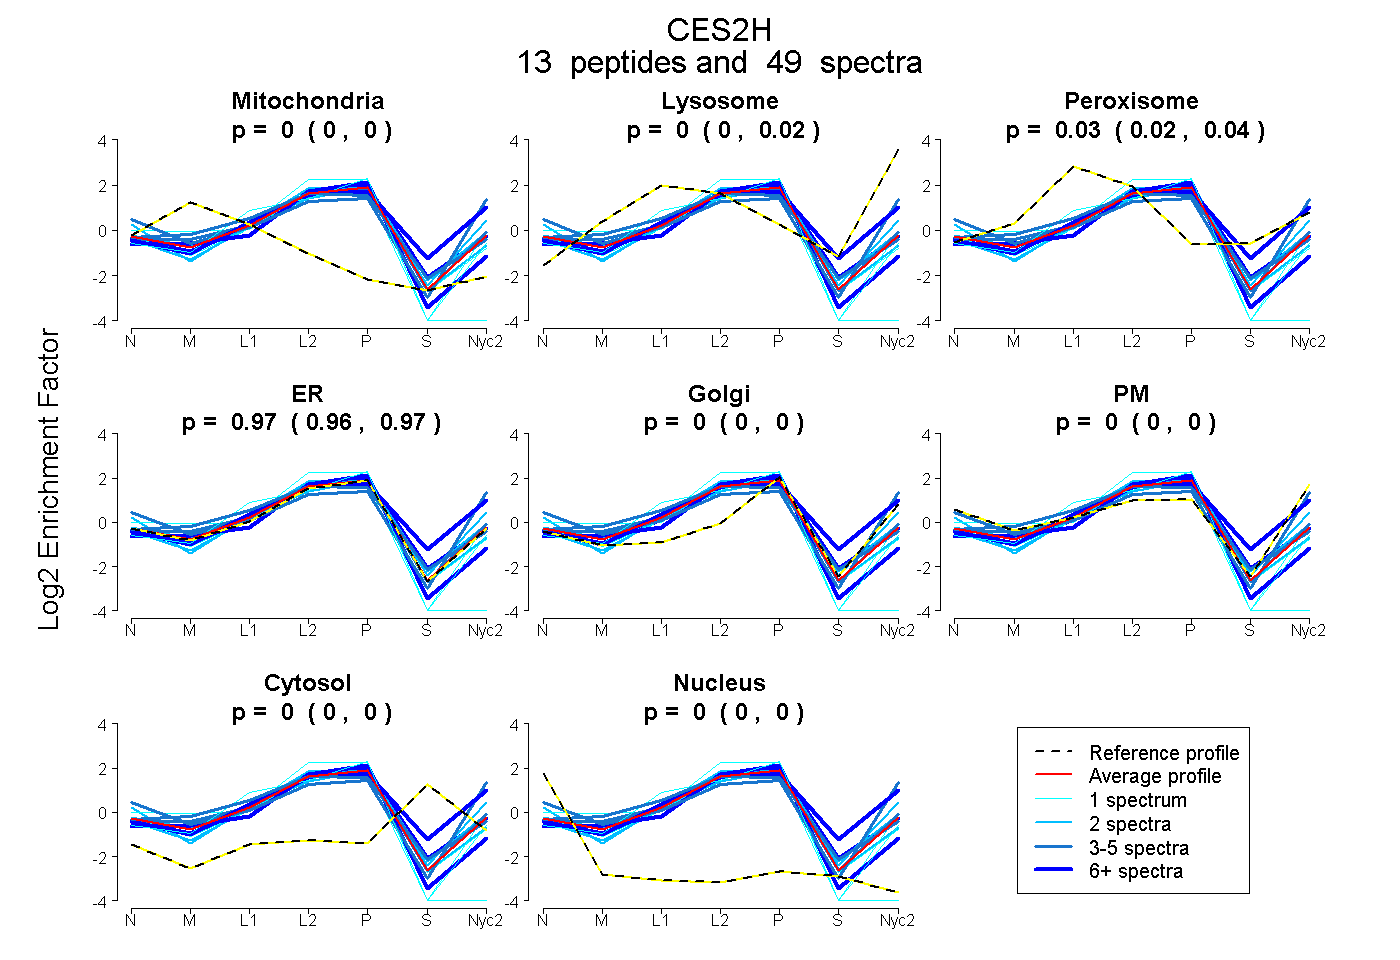 |
0.000
0.000 | 0.000 |
0.000
0.000 | 0.016 |
|
0.034
0.017 | 0.040 |
0.966
0.956 | 0.974 |
0.000
0.000 | 0.000 |
0.000
0.000 | 0.000 |
0.000
0.000 | 0.000 |
0.000
0.000 | 0.000 |
|
| | | Plot |
Mito |
|
Lyso or Perox |
|
ER |
Golgi |
PM |
Cytosol |
Nucleus |
|
| Expt B |
3
peptides |
12
spectra |
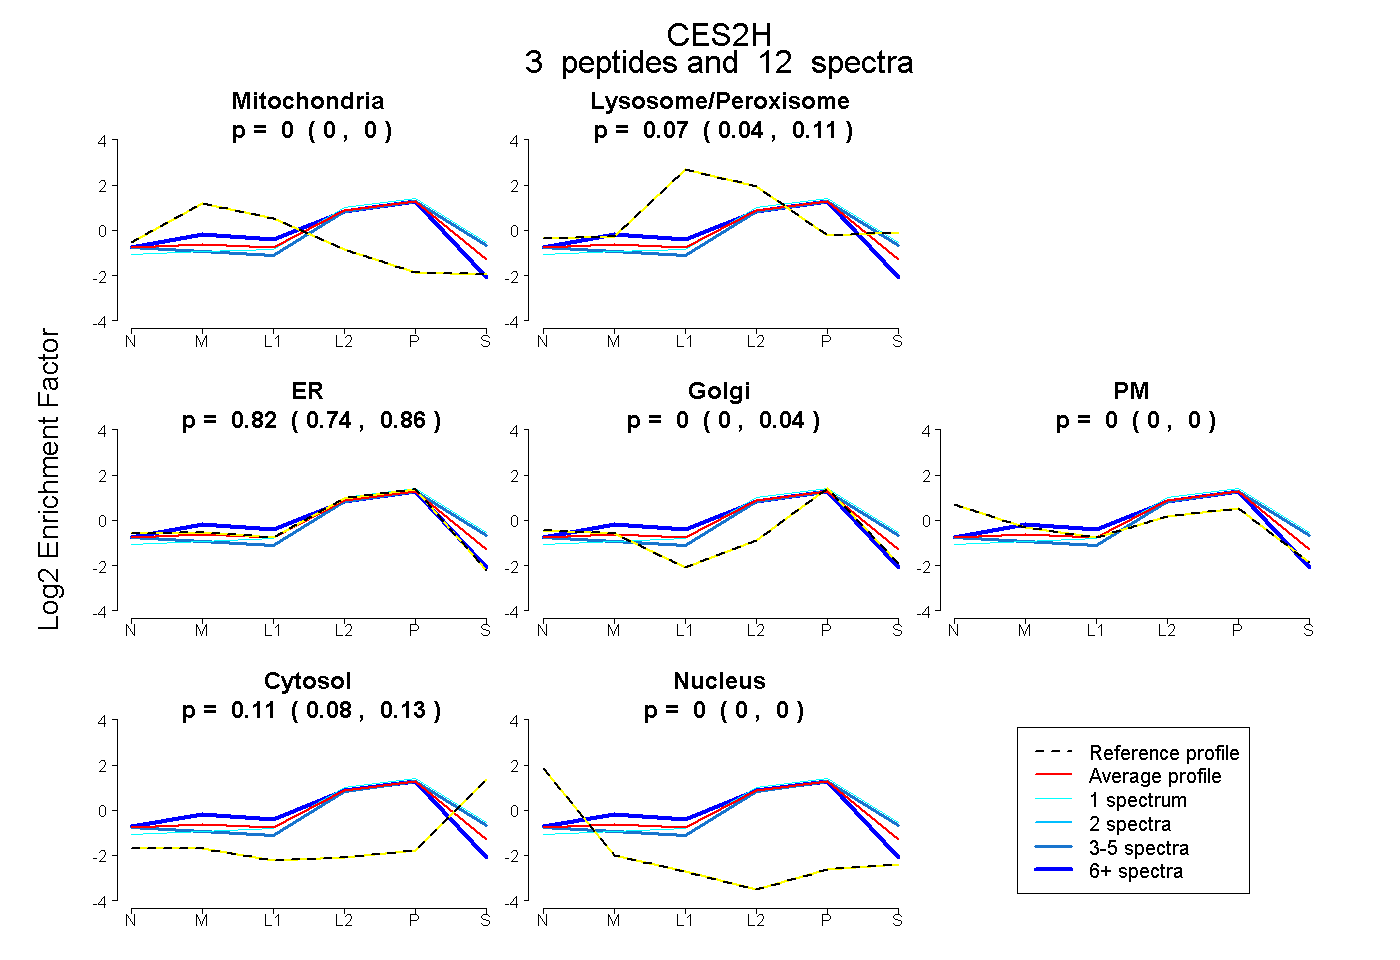 |
0.000
0.000 | 0.000 |
|
0.075
0.041 | 0.110 |
|
0.816
0.739 | 0.858 |
0.000
0.000 | 0.036 |
0.000
0.000 | 0.000 |
0.109
0.076 | 0.132 |
0.000
0.000 | 0.000 |
|
| 3 spectra, ALVNCLR |
0.000 |
|
0.059 |
|
0.743 |
0.000 |
0.000 |
0.199 |
0.000 |
|
| 8 spectra, ADHGDEILFIFR |
0.064 |
|
0.047 |
|
0.889 |
0.000 |
0.000 |
0.000 |
0.000 |
|
| 1 spectrum, QMVQAILQK |
0.000 |
|
0.118 |
|
0.706 |
0.000 |
0.000 |
0.176 |
0.000 |
|
| | | Plot |
|
Lyso |
|
|
|
|
|
|
|
Other |
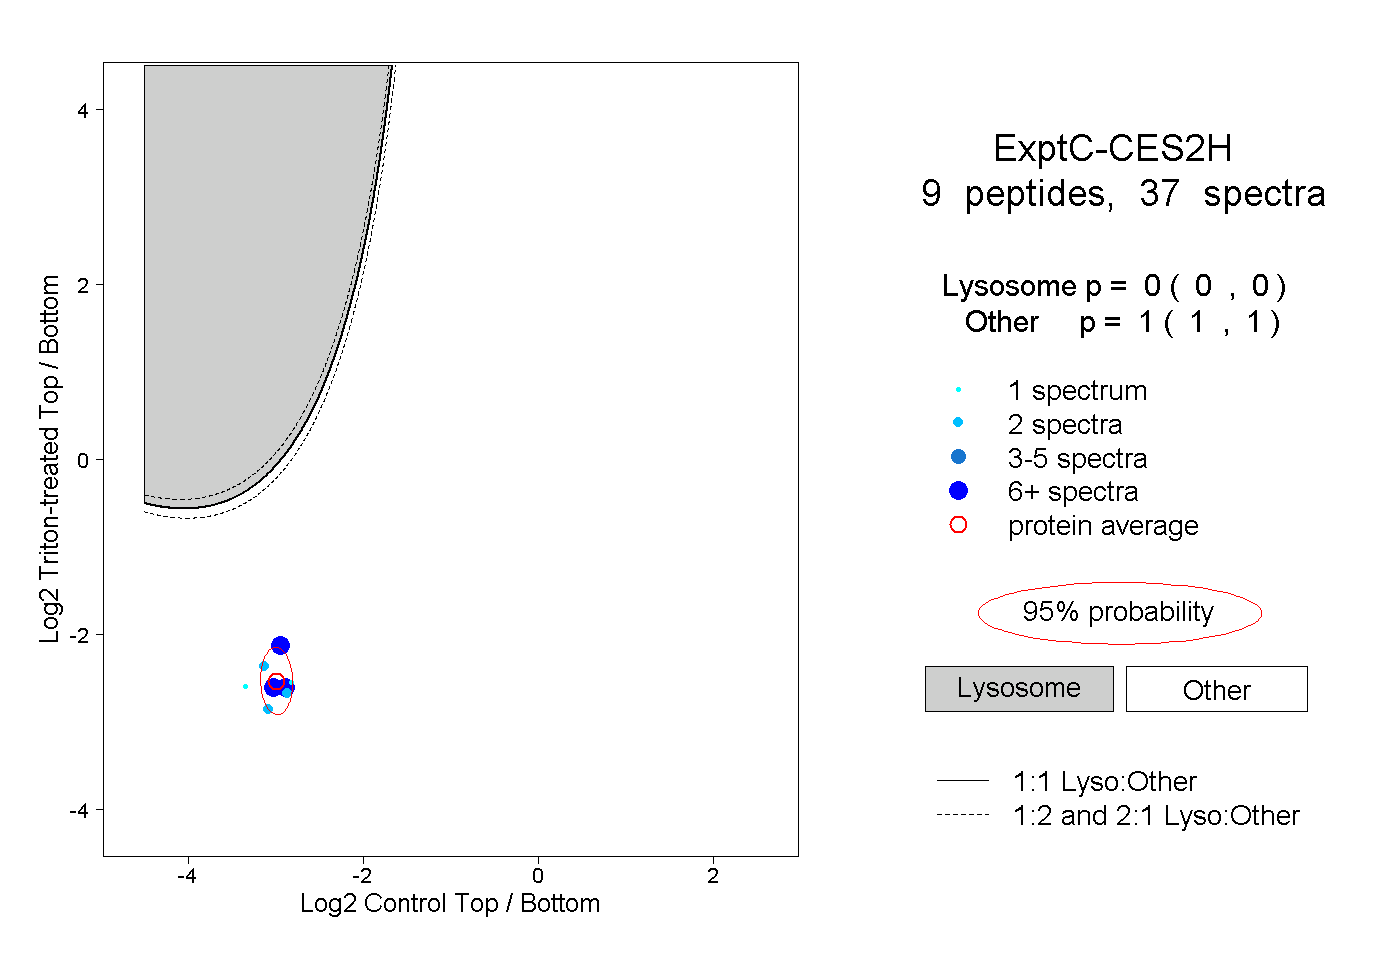
| Expt C |
9
peptides |
37
spectra |
 |
|
0.000
0.000 | 0.000 |
|
|
|
|
|
|
|
1.000
1.000 | 1.000 |
| | | Plot |
|
Lyso |
|
|
|
|
|
|
|
Other |
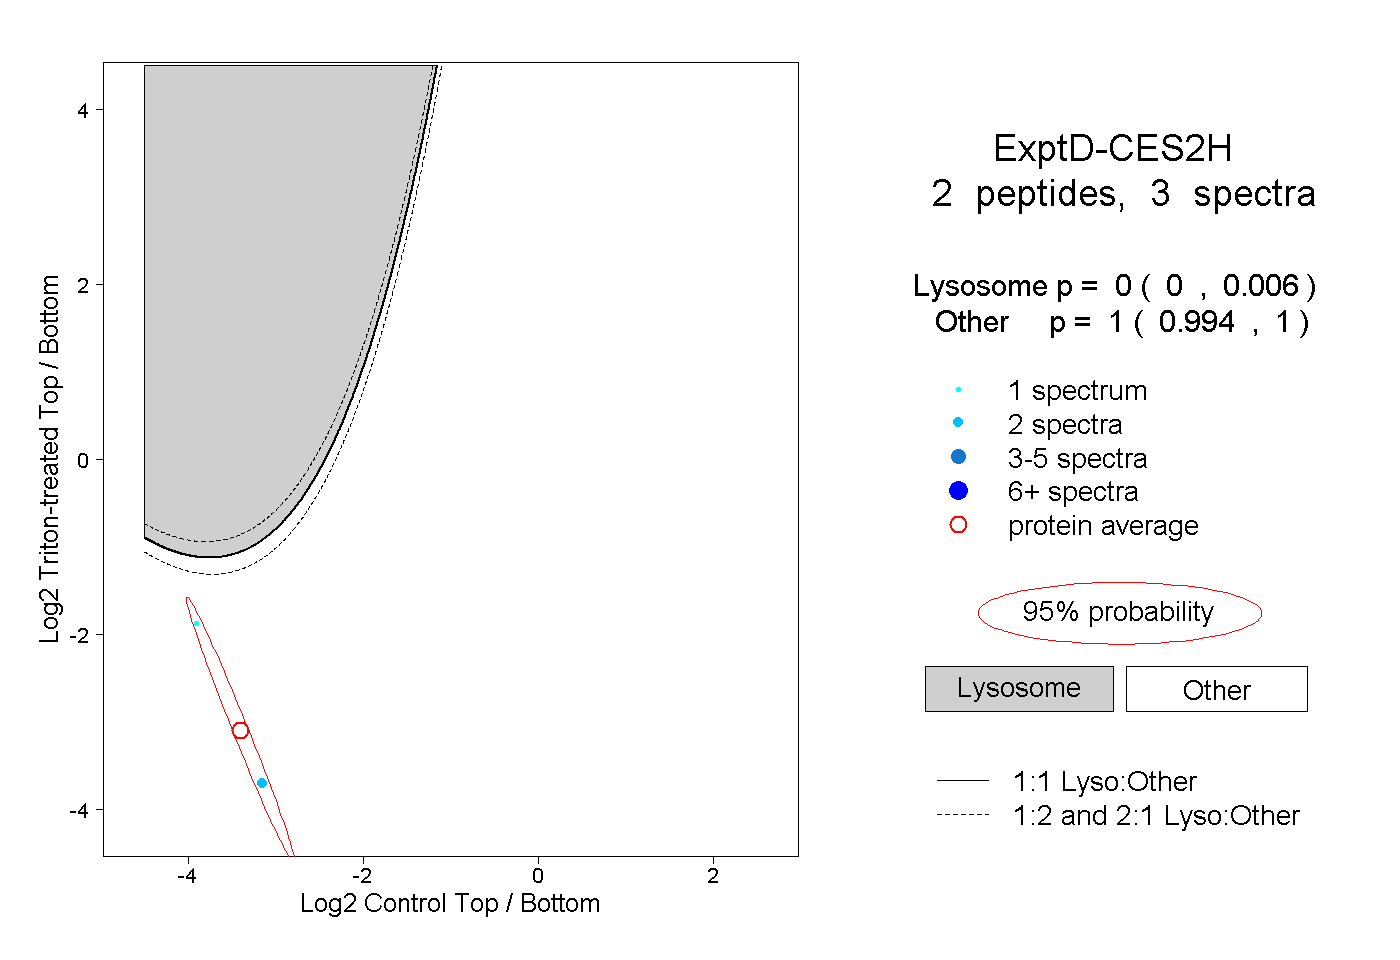
| Expt D |
2
peptides |
3
spectra |
 |
|
0.000
0.000 | 0.006 |
|
|
|
|
|
|
|
1.000
0.994 | 1.000 |