 13
13peptides
spectra
0.000 | 0.000
0.000 | 0.016
0.017 | 0.040
0.956 | 0.974
0.000 | 0.000
0.000 | 0.000
0.000 | 0.000
0.000 | 0.000
| Plot | Mito | Lyso | Perox | ER | Golgi | PM | Cytosol | Nucleus | |||||
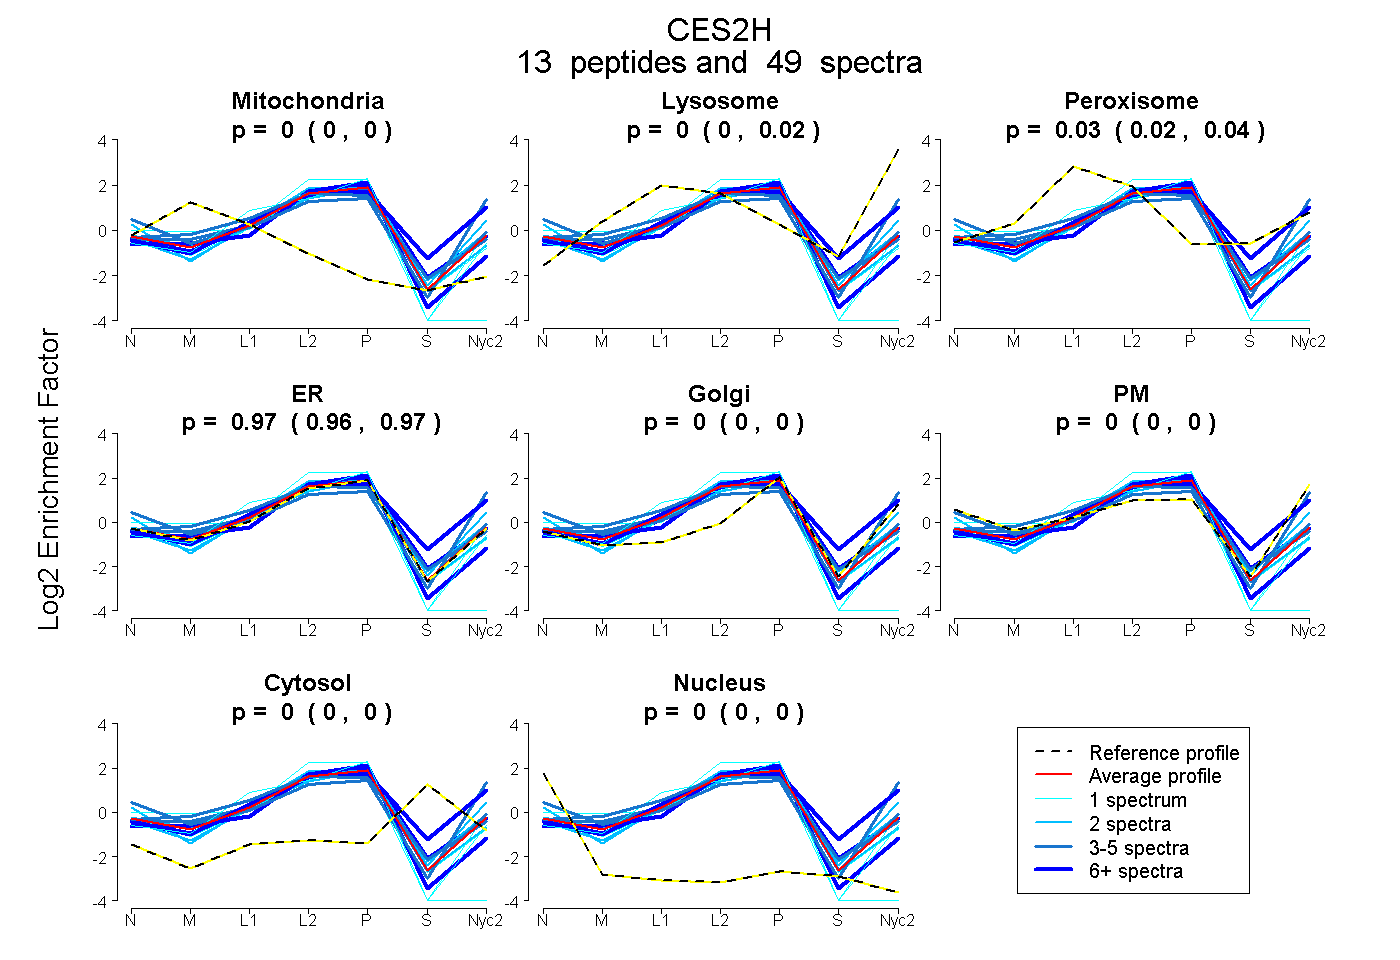
| Expt A |
13 peptides |
49 spectra |
|
0.000 0.000 | 0.000 |
0.000 0.000 | 0.016 |
0.034 0.017 | 0.040 |
0.966 0.956 | 0.974 |
0.000 0.000 | 0.000 |
0.000 0.000 | 0.000 |
0.000 0.000 | 0.000 |
0.000 0.000 | 0.000 |
| 5 spectra, TTHTGQILGSLIHMK | 0.040 | 0.000 | 0.167 | 0.794 | 0.000 | 0.000 | 0.000 | 0.000 | ||
| 2 spectra, ALVNCLR | 0.000 | 0.000 | 0.000 | 0.999 | 0.000 | 0.000 | 0.000 | 0.001 | ||
| 1 spectrum, FAPPEAPEPWSGVR | 0.000 | 0.000 | 0.000 | 0.994 | 0.000 | 0.000 | 0.000 | 0.006 | ||
| 2 spectra, LGVLGFFSTGDEHAR | 0.000 | 0.019 | 0.077 | 0.905 | 0.000 | 0.000 | 0.000 | 0.000 | ||
| 2 spectra, DSKPPHVK | 0.000 | 0.000 | 0.000 | 0.674 | 0.040 | 0.280 | 0.005 | 0.000 | ||
| 14 spectra, ADHGDEILFIFR | 0.000 | 0.004 | 0.034 | 0.914 | 0.000 | 0.000 | 0.047 | 0.000 | ||
| 6 spectra, SEEEIMSINK | 0.000 | 0.274 | 0.000 | 0.601 | 0.037 | 0.000 | 0.087 | 0.000 | ||
| 1 spectrum, SNAPVYFYEFQHRPSFFK | 0.000 | 0.000 | 0.000 | 1.000 | 0.000 | 0.000 | 0.000 | 0.000 | ||
| 1 spectrum, IISGIVDGIFLPR | 0.000 | 0.000 | 0.000 | 1.000 | 0.000 | 0.000 | 0.000 | 0.000 | ||
| 8 spectra, LQFWTK | 0.014 | 0.000 | 0.000 | 0.978 | 0.000 | 0.000 | 0.000 | 0.009 | ||
| 1 spectrum, EMMEDFTFVIPALQVAHFQR | 0.186 | 0.000 | 0.000 | 0.730 | 0.000 | 0.000 | 0.000 | 0.083 | ||
| 3 spectra, QMVQAILQK | 0.000 | 0.000 | 0.000 | 0.247 | 0.000 | 0.753 | 0.000 | 0.000 | ||
| 3 spectra, LGVLGFFSTGDQHAR | 0.009 | 0.065 | 0.000 | 0.927 | 0.000 | 0.000 | 0.000 | 0.000 |
| Plot | Mito | Lyso or Perox | ER | Golgi | PM | Cytosol | Nucleus | ||||||
| Expt B |
3 peptides |
12 spectra |
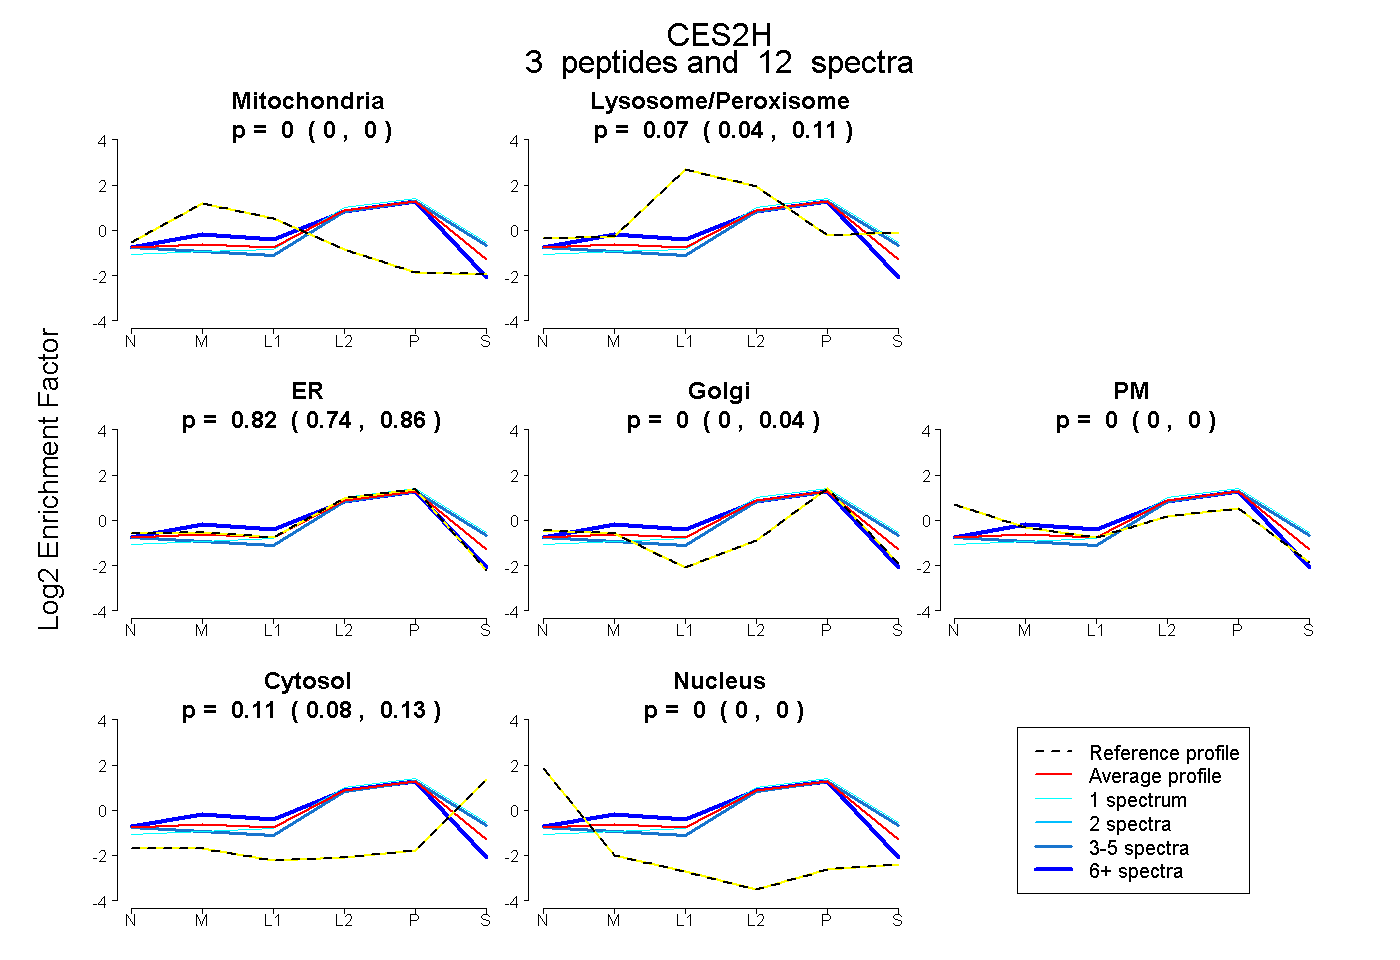 |
0.000 0.000 | 0.000 |
0.075 0.041 | 0.110 |
0.816 0.739 | 0.858 |
0.000 0.000 | 0.036 |
0.000 0.000 | 0.000 |
0.109 0.076 | 0.132 |
0.000 0.000 | 0.000 |
|||
| Plot | Lyso | Other | |||||||||||
| Expt C |
9 peptides |
37 spectra |
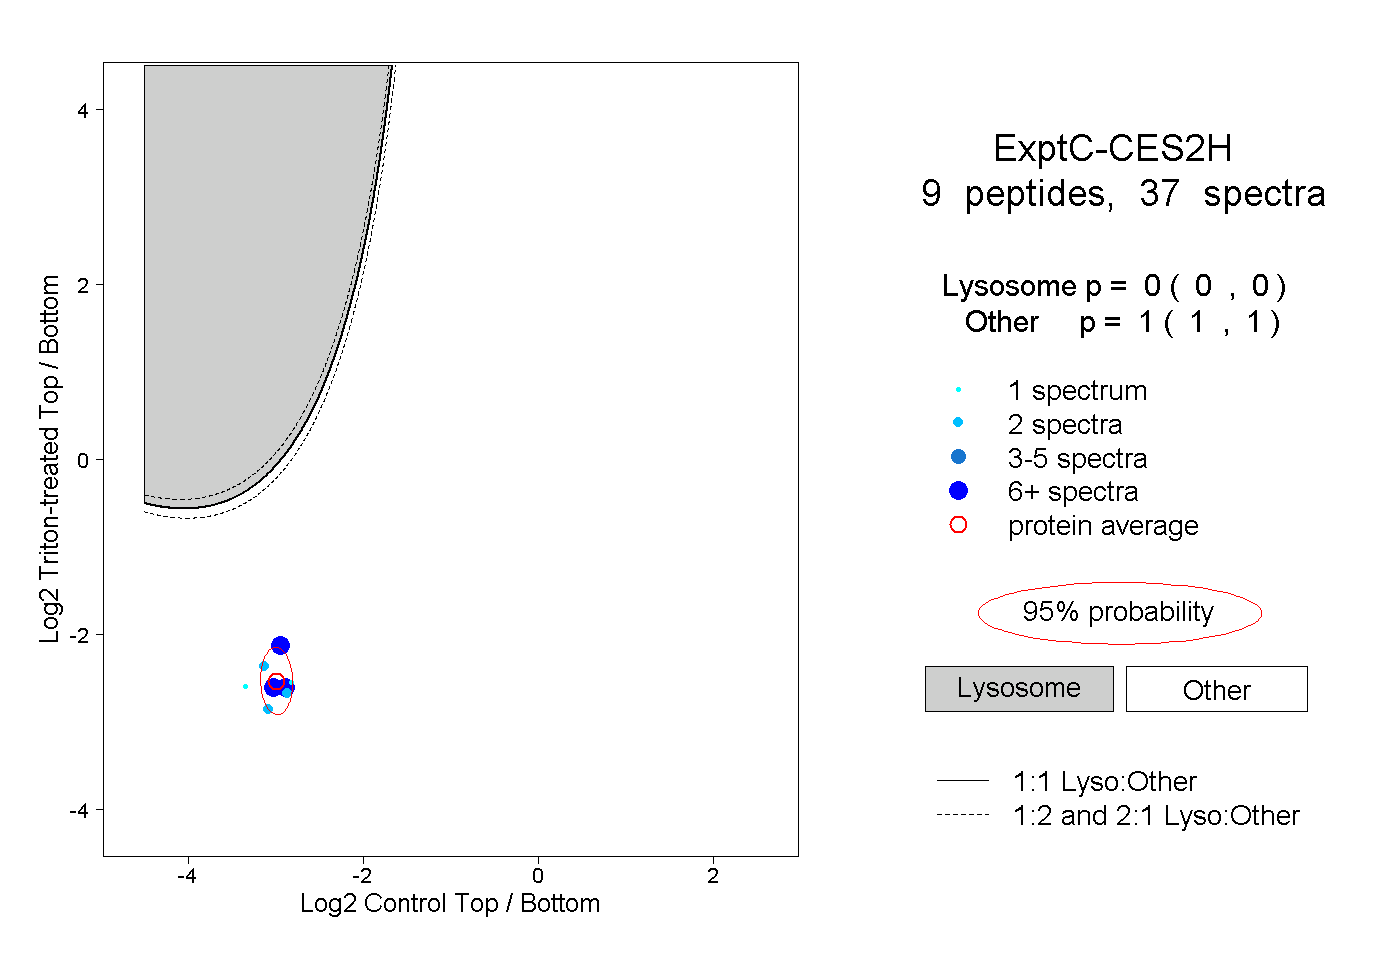 |
0.000 0.000 | 0.000 |
1.000 1.000 | 1.000 |
||||||||
| Plot | Lyso | Other | |||||||||||
| Expt D |
2 peptides |
3 spectra |
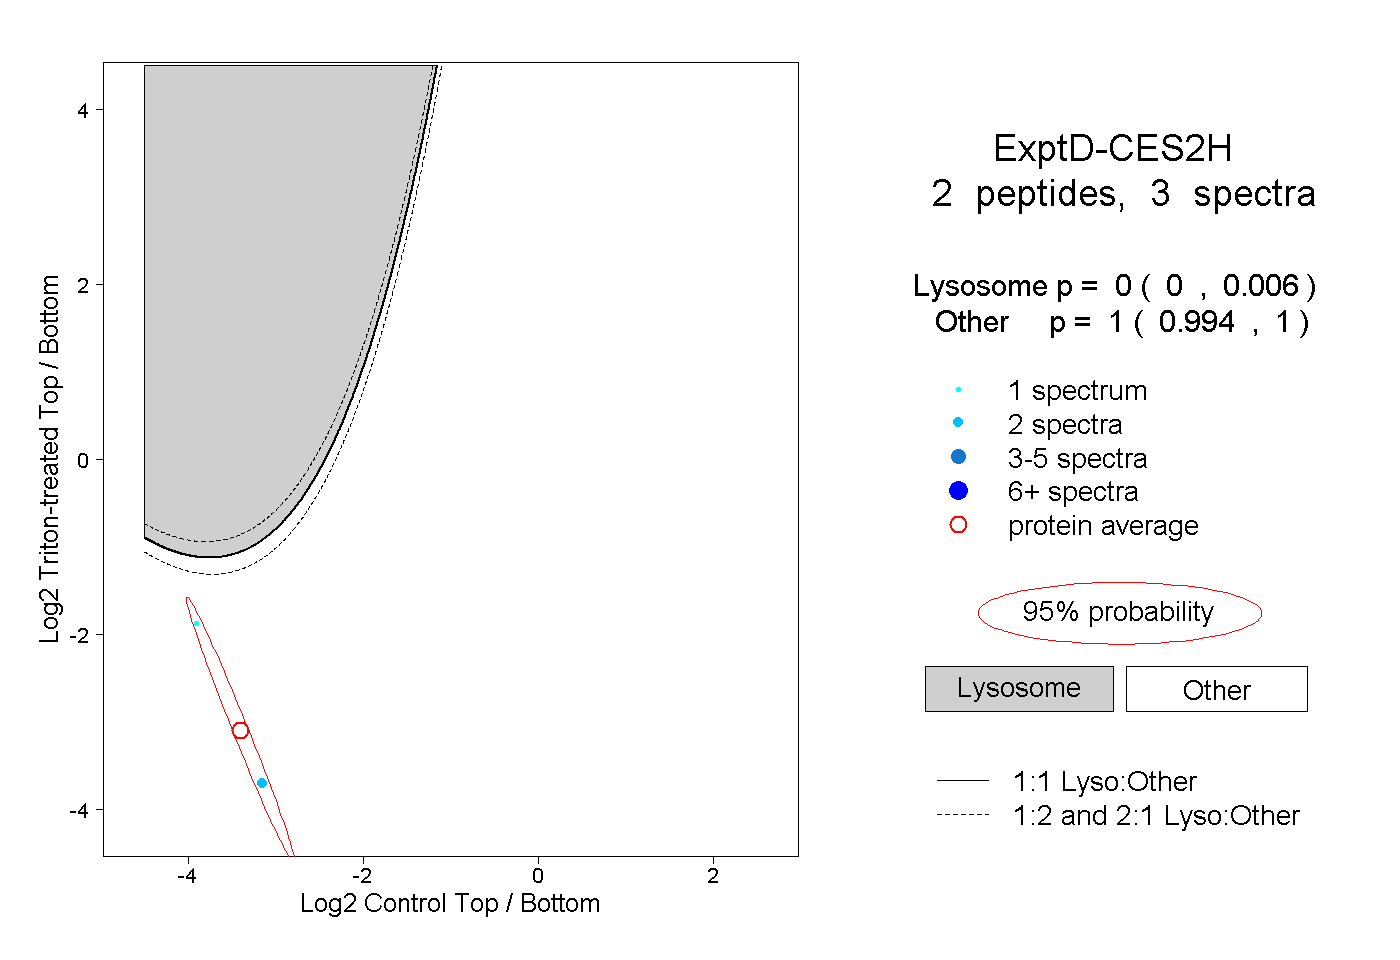 |
0.000 0.000 | 0.006 |
1.000 0.994 | 1.000 |