 22
22peptides
spectra
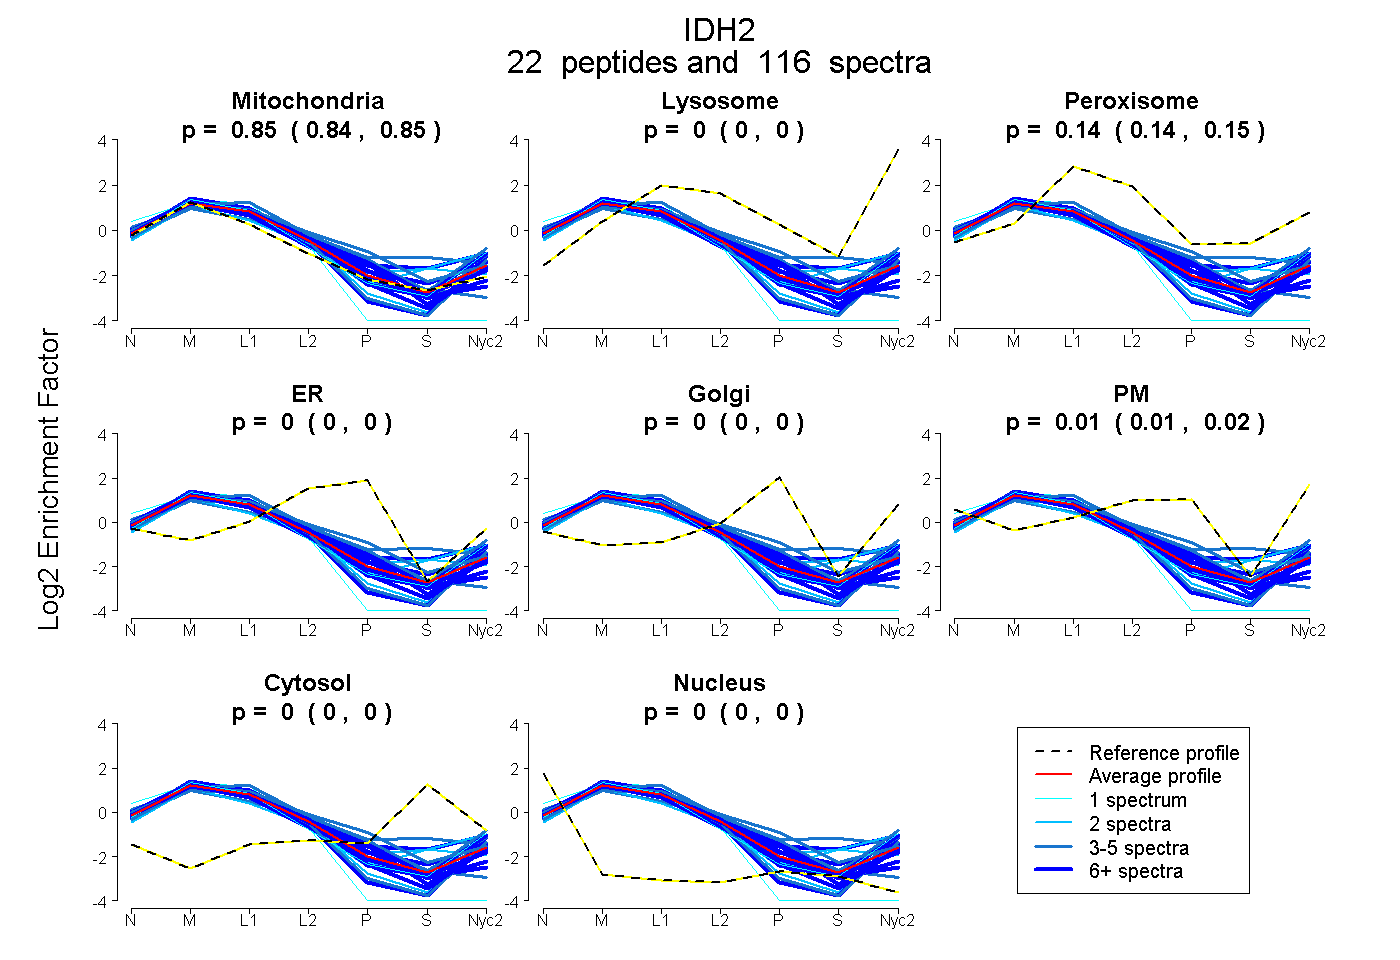
0.843 | 0.850
0.000 | 0.000
0.138 | 0.145
0.000 | 0.000
0.000 | 0.000
0.006 | 0.016
0.000 | 0.000
0.000 | 0.000
22peptides
spectra
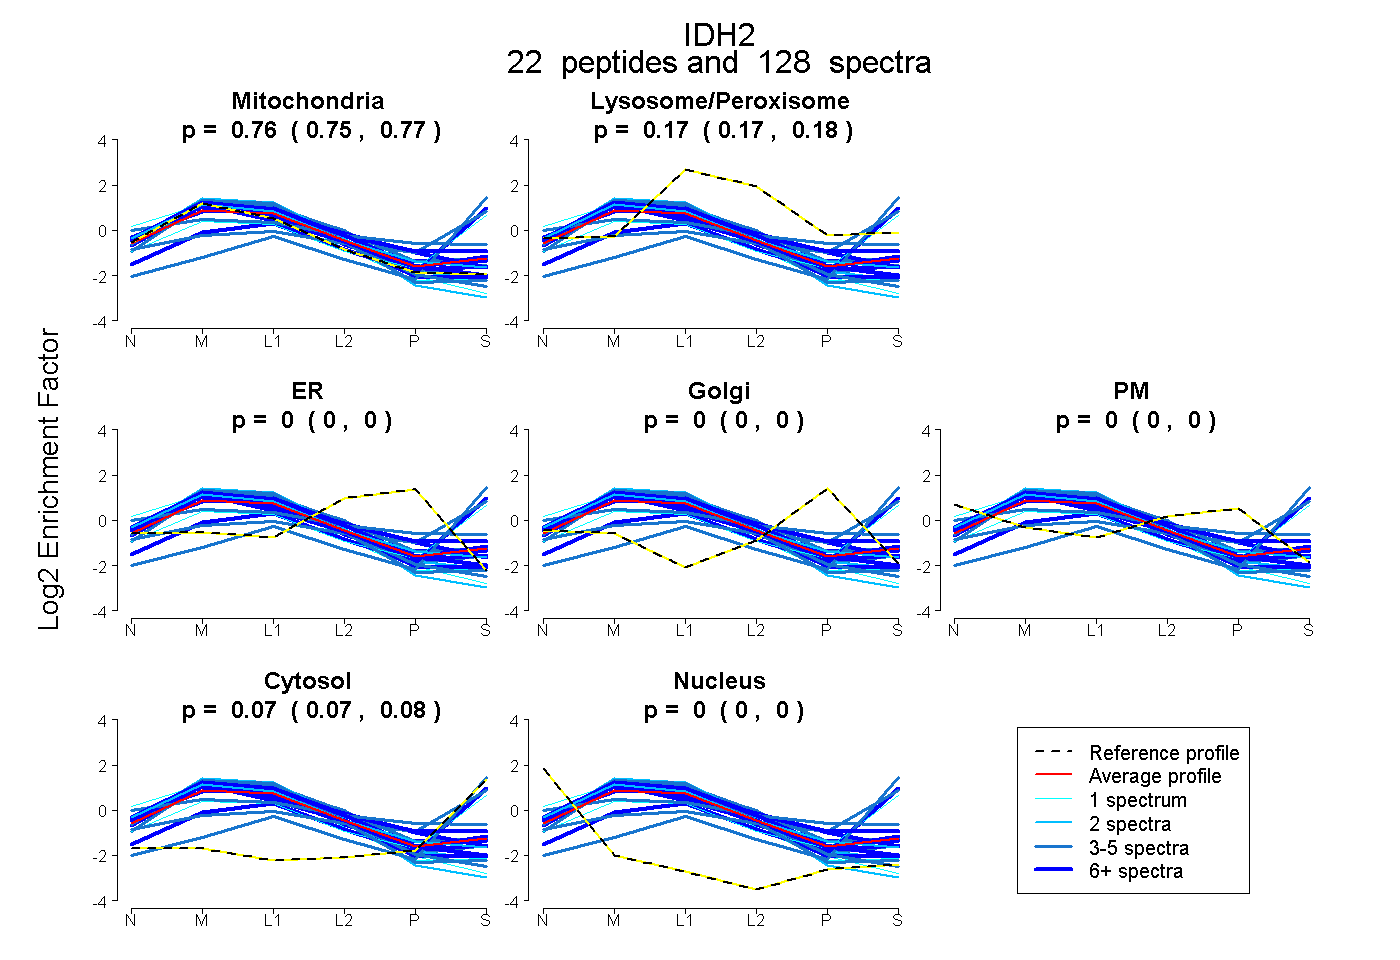
0.749 | 0.765
0.167 | 0.176
0.000 | 0.000
0.000 | 0.000
0.000 | 0.000
0.065 | 0.075
0.000 | 0.000
24peptides
spectra
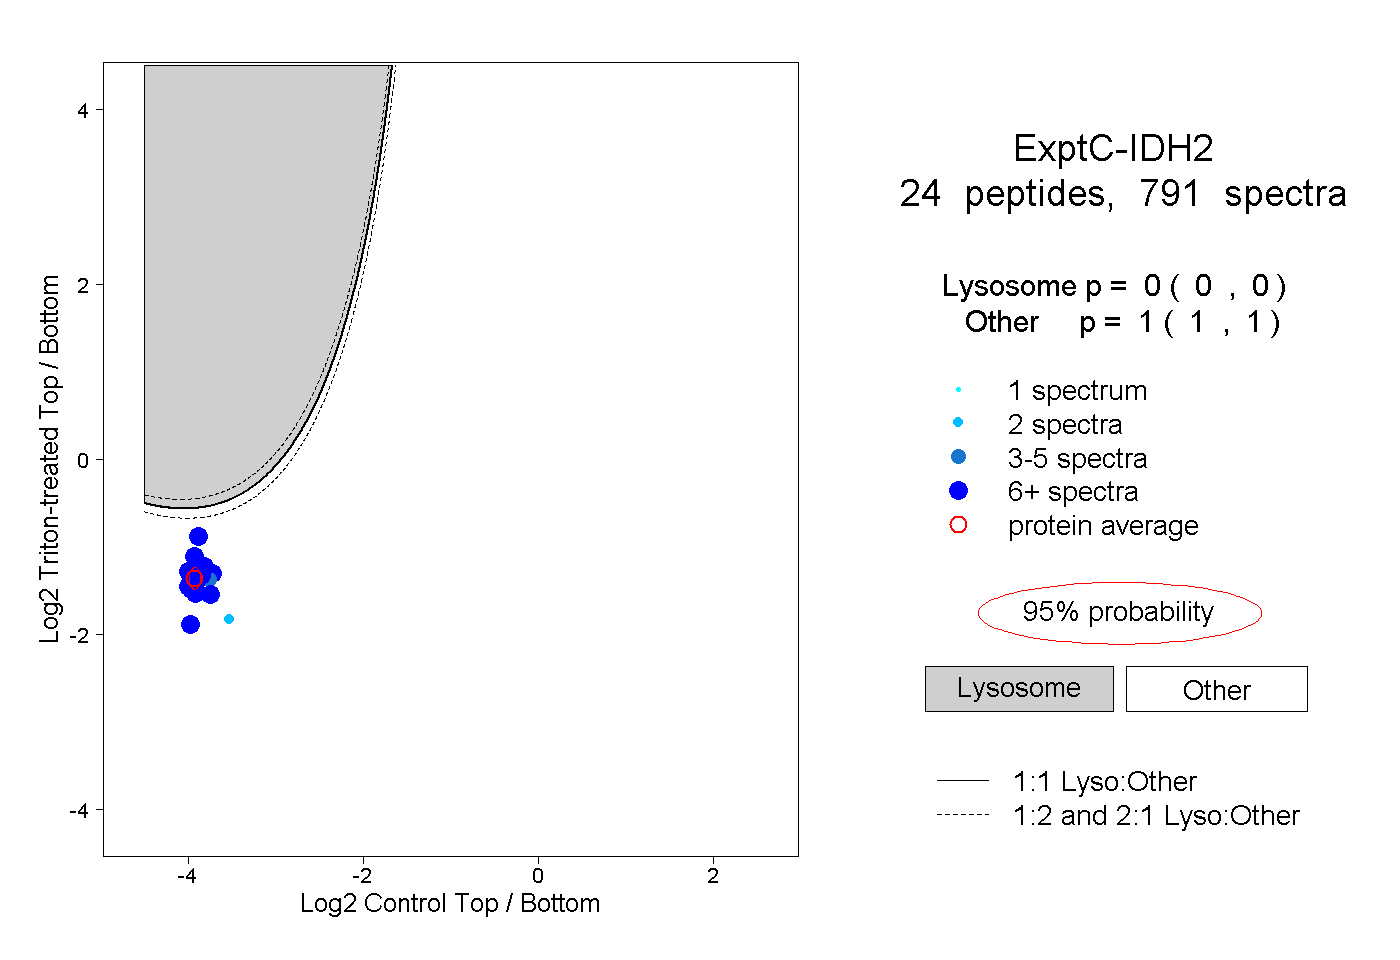
0.000 | 0.000
1.000 | 1.000
11peptides
spectra
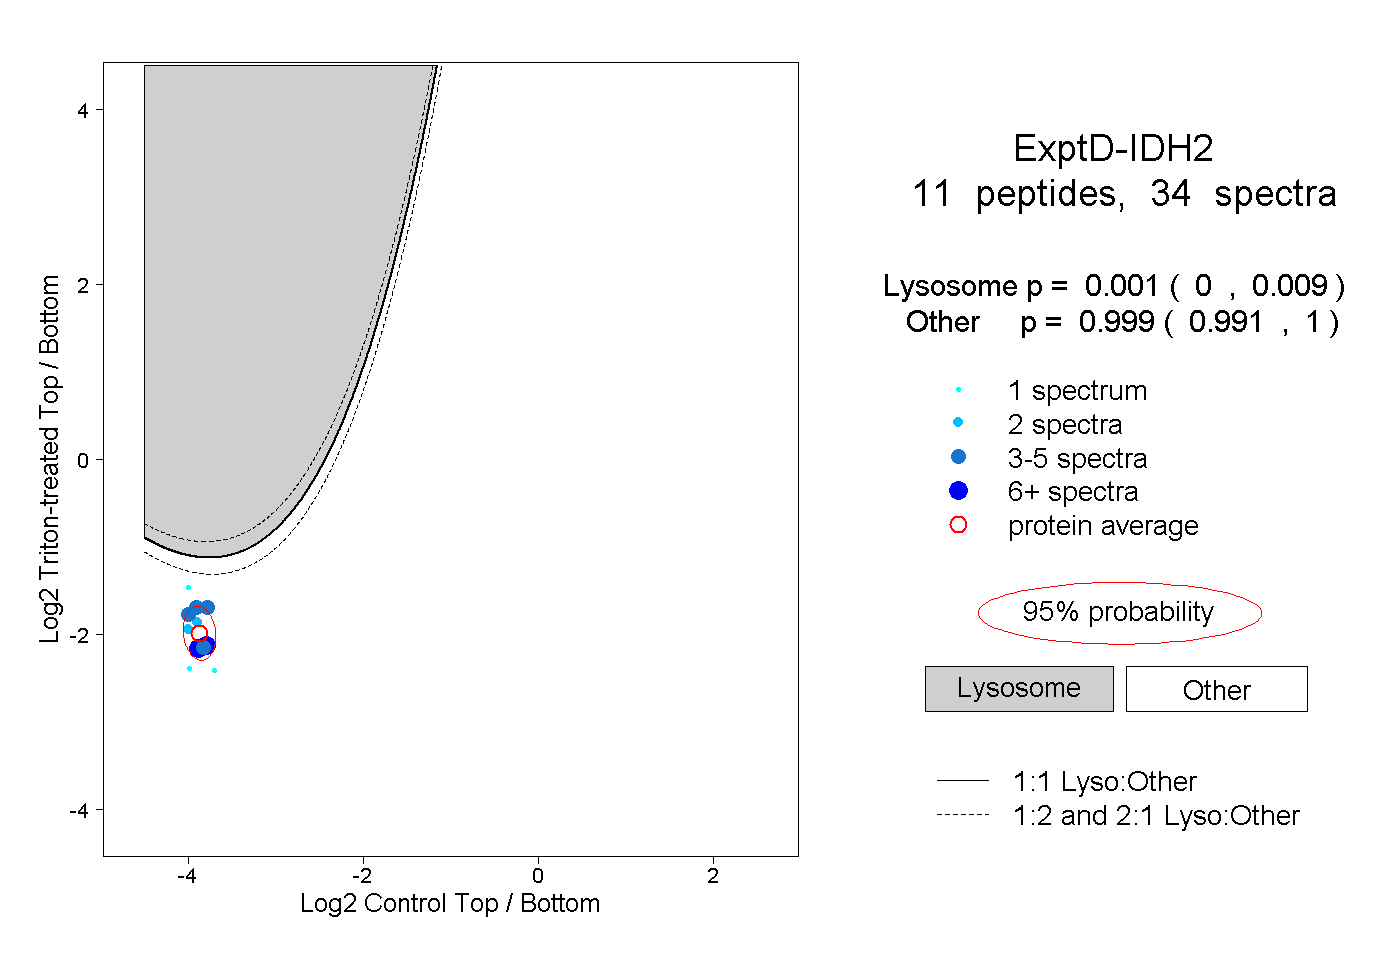
0.000 | 0.009
0.991 | 1.000