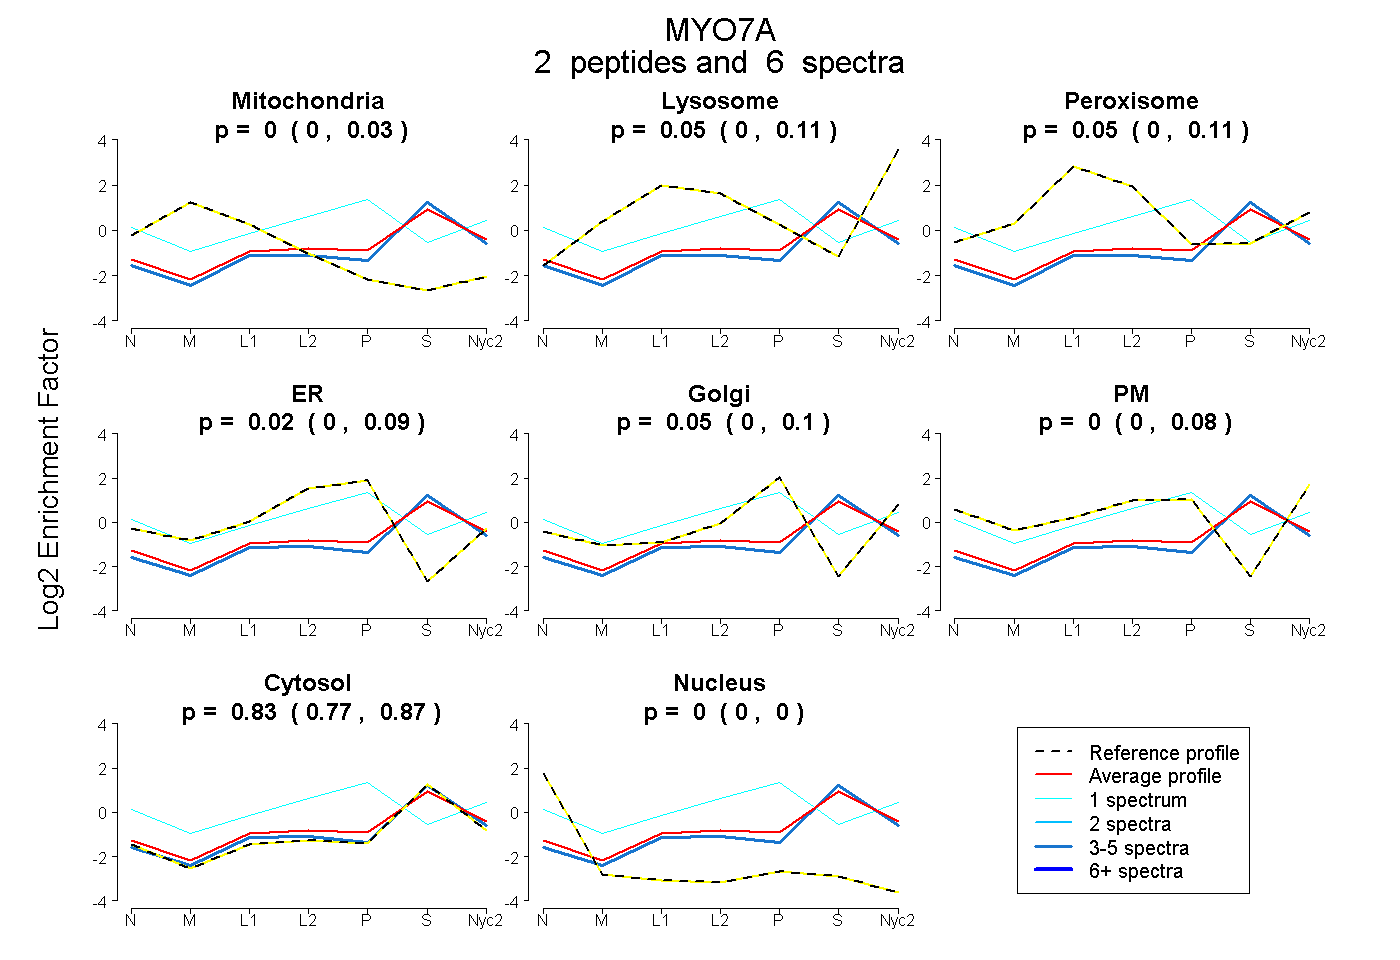
 2
2peptides
spectra
0.000 | 0.029
0.000 | 0.106
0.000 | 0.110
0.000 | 0.092
0.000 | 0.102
0.000 | 0.078
0.768 | 0.875
0.000 | 0.000
| Plot | Mito | Lyso | Perox | ER | Golgi | PM | Cytosol | Nucleus | |||||
| Expt A |
2 peptides |
6 spectra |
|
0.000 0.000 | 0.029 |
0.053 0.000 | 0.106 |
0.053 0.000 | 0.110 |
0.018 0.000 | 0.092 |
0.047 0.000 | 0.102 |
0.000 0.000 | 0.078 |
0.829 0.768 | 0.875 |
0.000 0.000 | 0.000 |
| 1 spectrum, LQALHR | 0.000 | 0.000 | 0.121 | 0.199 | 0.203 | 0.246 | 0.231 | 0.000 | ||
| 5 spectra, GMIAR | 0.000 | 0.046 | 0.013 | 0.000 | 0.000 | 0.000 | 0.941 | 0.000 |