 4
4peptides
spectra
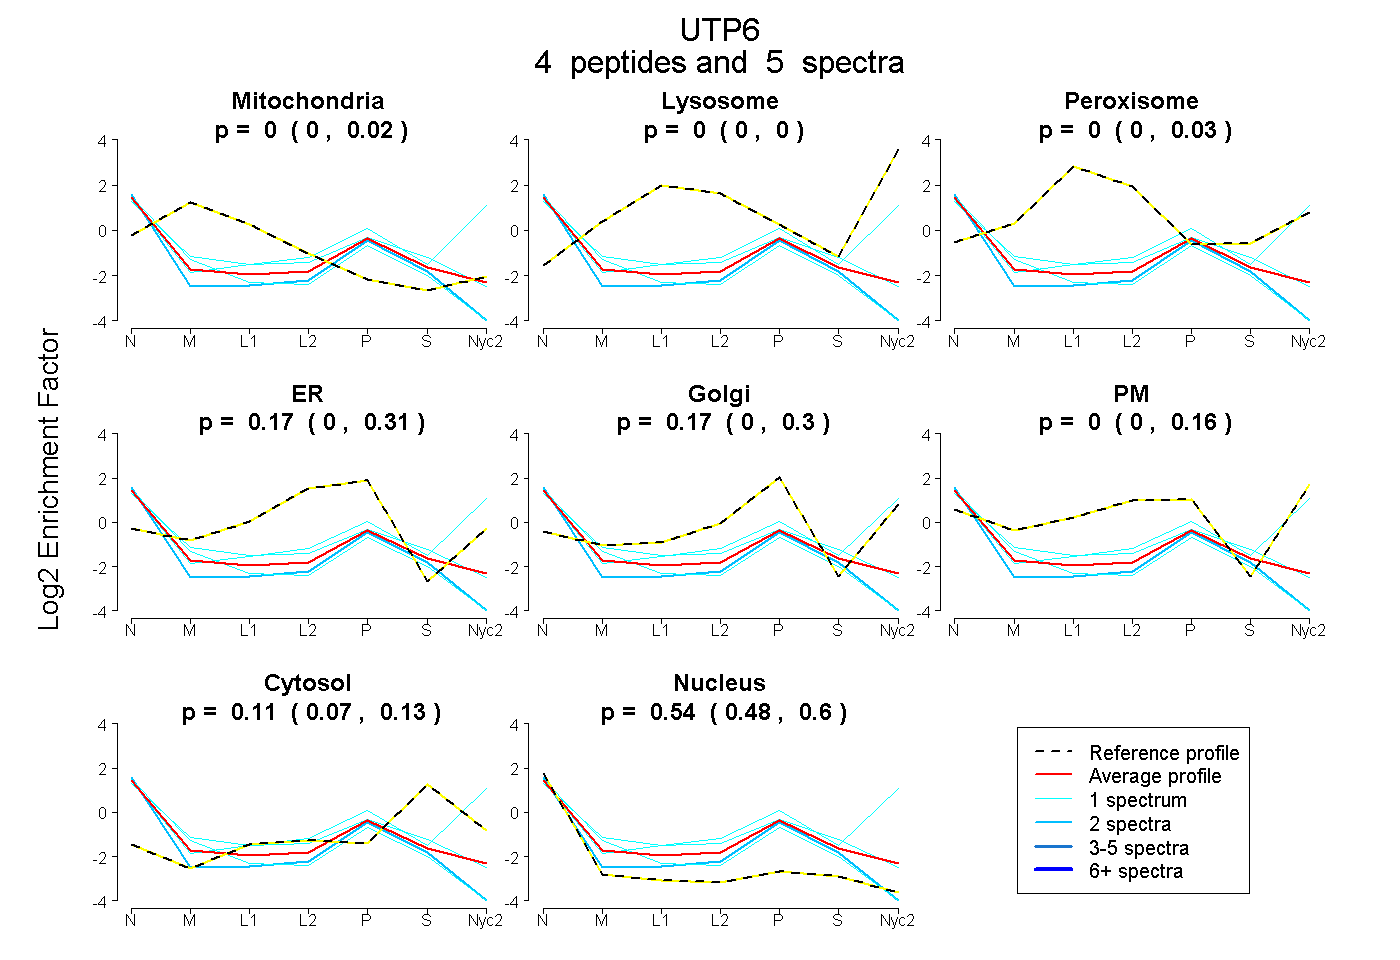
0.000 | 0.023
0.000 | 0.000
0.000 | 0.033
0.000 | 0.313
0.000 | 0.299
0.000 | 0.163
0.066 | 0.133
0.484 | 0.598
| Plot | Mito | Lyso | Perox | ER | Golgi | PM | Cytosol | Nucleus | |||||
| Expt A |
4 peptides |
5 spectra |
|
0.000 0.000 | 0.023 |
0.000 0.000 | 0.000 |
0.000 0.000 | 0.033 |
0.173 0.000 | 0.313 |
0.174 0.000 | 0.299 |
0.000 0.000 | 0.163 |
0.108 0.066 | 0.133 |
0.545 0.484 | 0.598 |
| 1 spectrum, LLVLIDSK | 0.095 | 0.000 | 0.004 | 0.302 | 0.000 | 0.000 | 0.168 | 0.431 | ||
| 2 spectra, IGLFSR | 0.000 | 0.000 | 0.000 | 0.202 | 0.000 | 0.000 | 0.051 | 0.747 | ||
| 1 spectrum, ASDLEYK | 0.000 | 0.000 | 0.000 | 0.000 | 0.079 | 0.515 | 0.166 | 0.240 | ||
| 1 spectrum, QWIDLLLR | 0.100 | 0.000 | 0.000 | 0.187 | 0.000 | 0.000 | 0.000 | 0.713 |
| Plot | Lyso | Other | |||||||||||
| Expt C |
1 peptide |
1 spectrum |
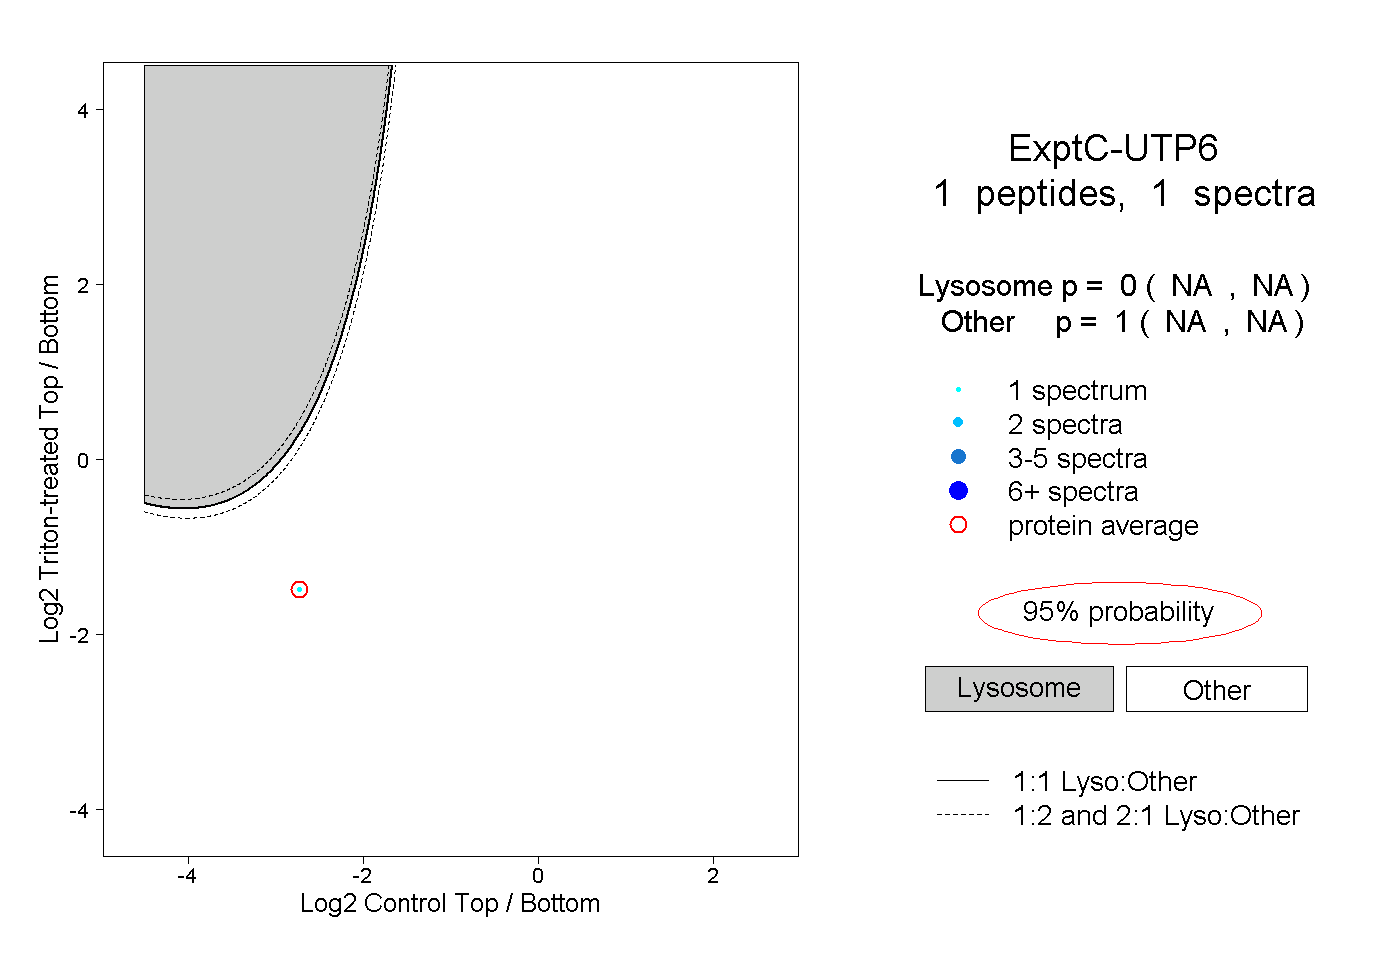 |
0.000 NA | NA |
1.000 NA | NA |