 4
4peptides
spectra
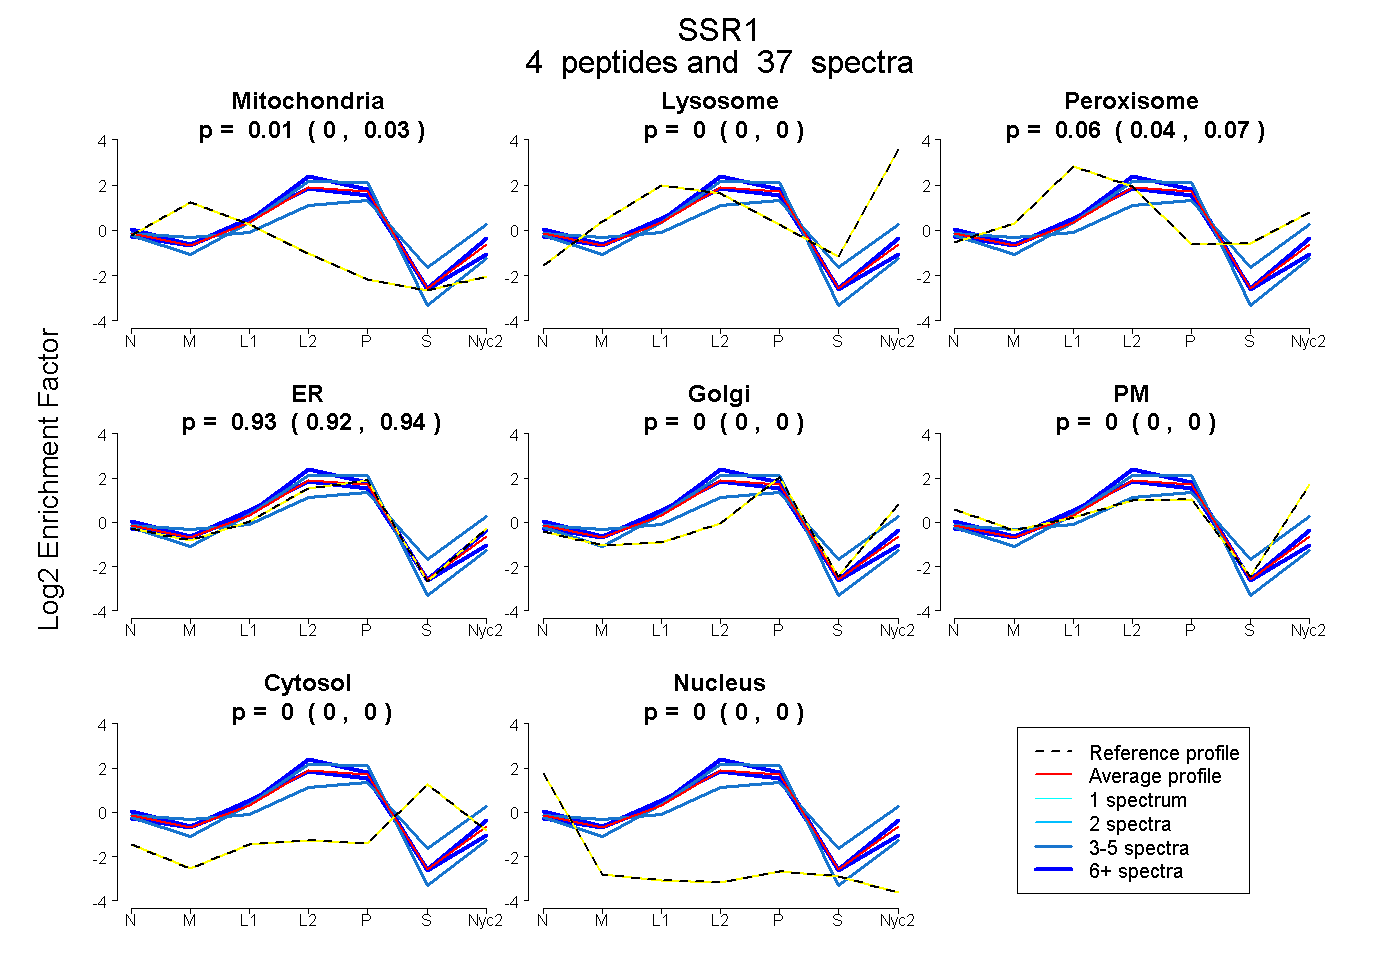
0.000 | 0.025
0.000 | 0.000
0.037 | 0.068
0.920 | 0.943
0.000 | 0.000
0.000 | 0.000
0.000 | 0.000
0.000 | 0.000
3peptides
spectra
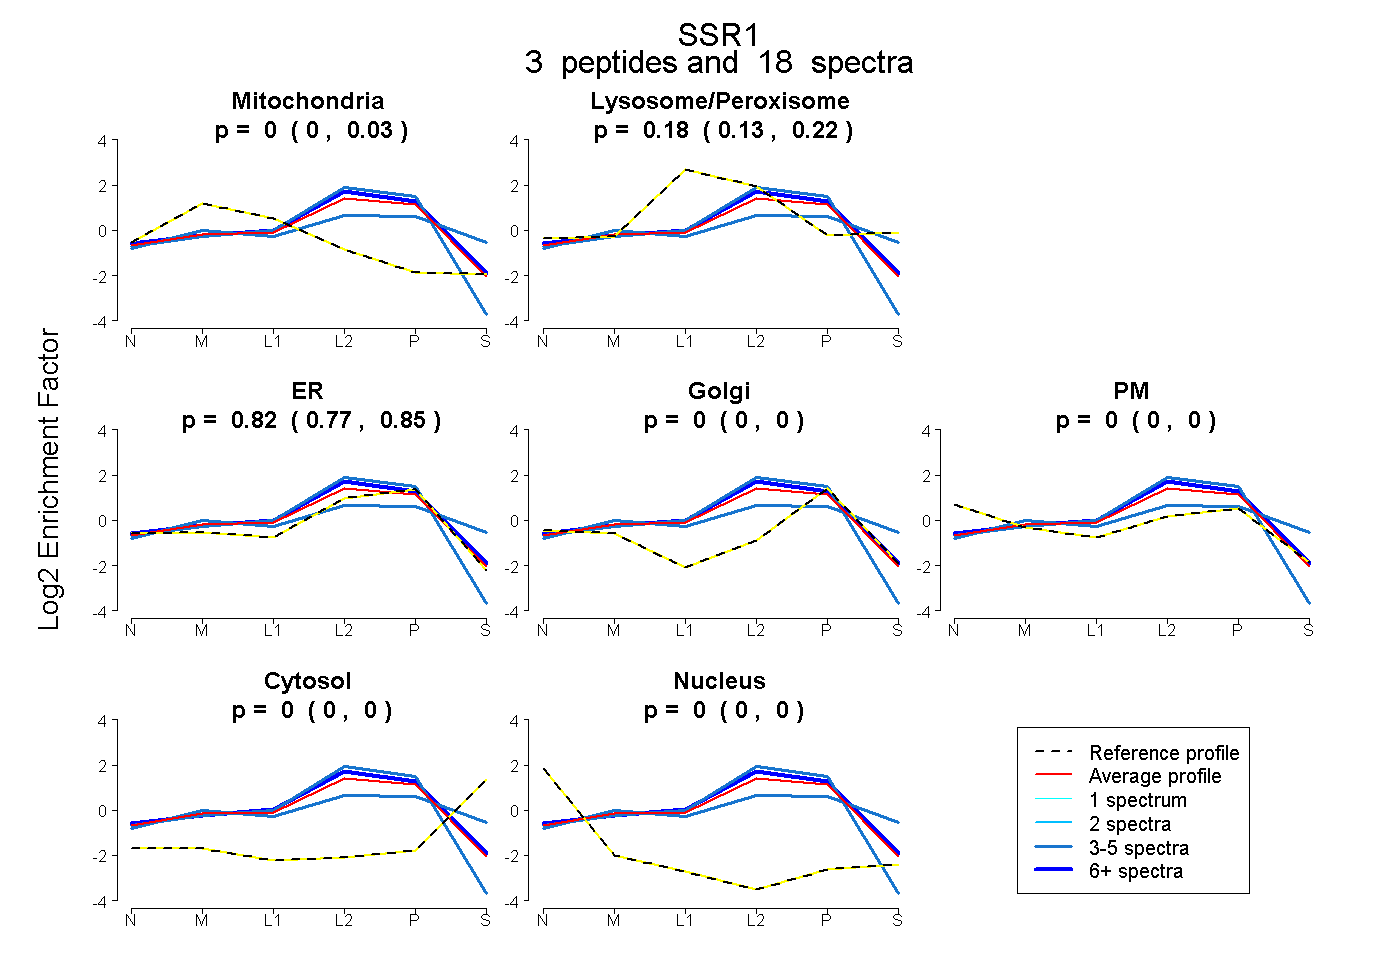
0.000 | 0.032
0.129 | 0.220
0.771 | 0.852
0.000 | 0.000
0.000 | 0.000
0.000 | 0.000
0.000 | 0.000
3peptides
spectra
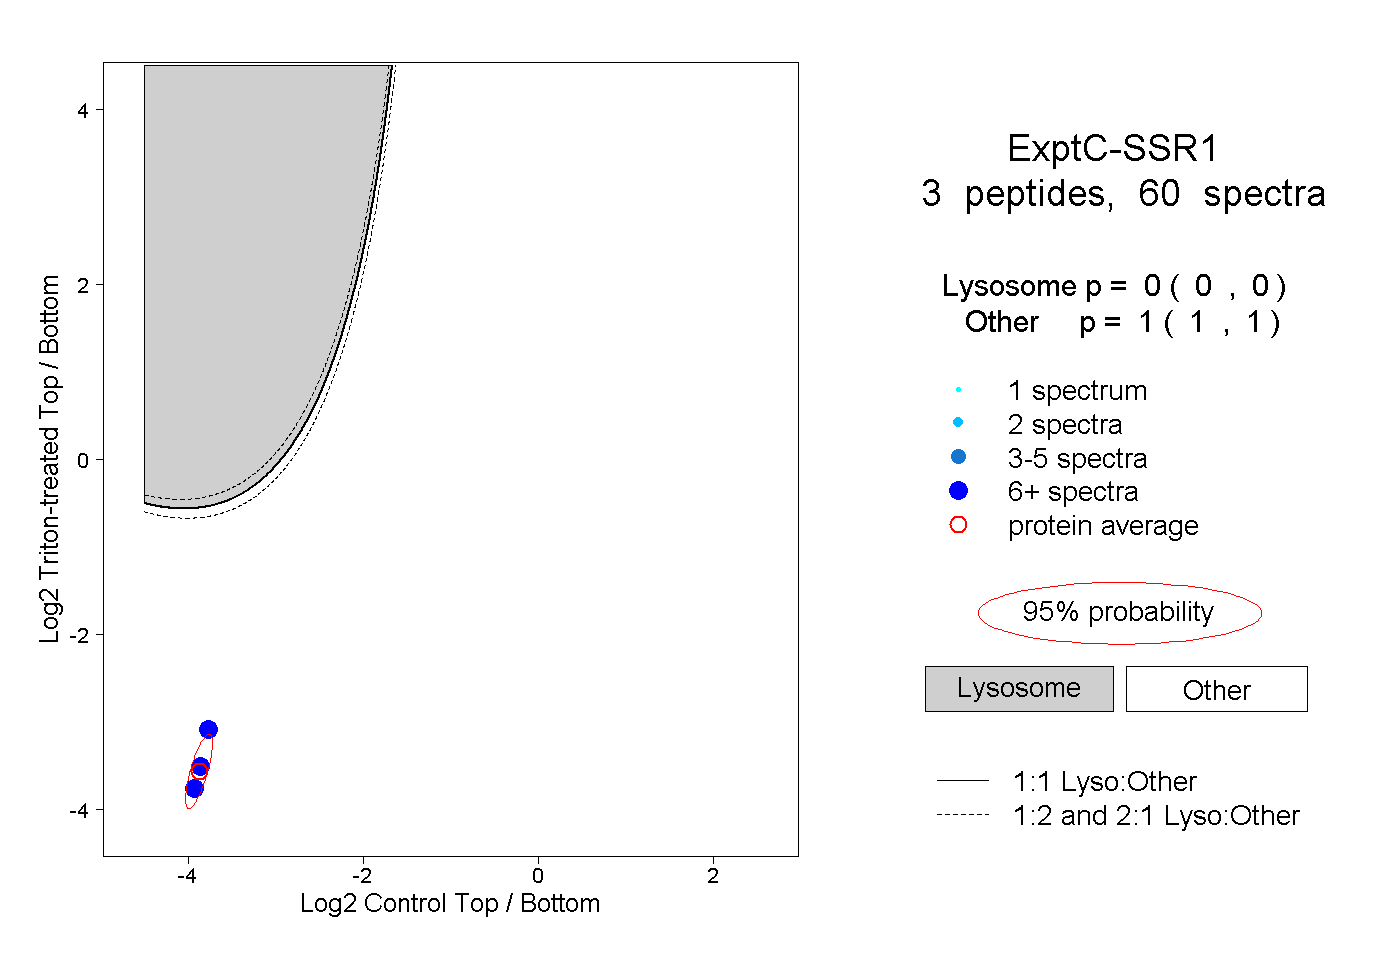
0.000 | 0.000
1.000 | 1.000
3peptides
spectra
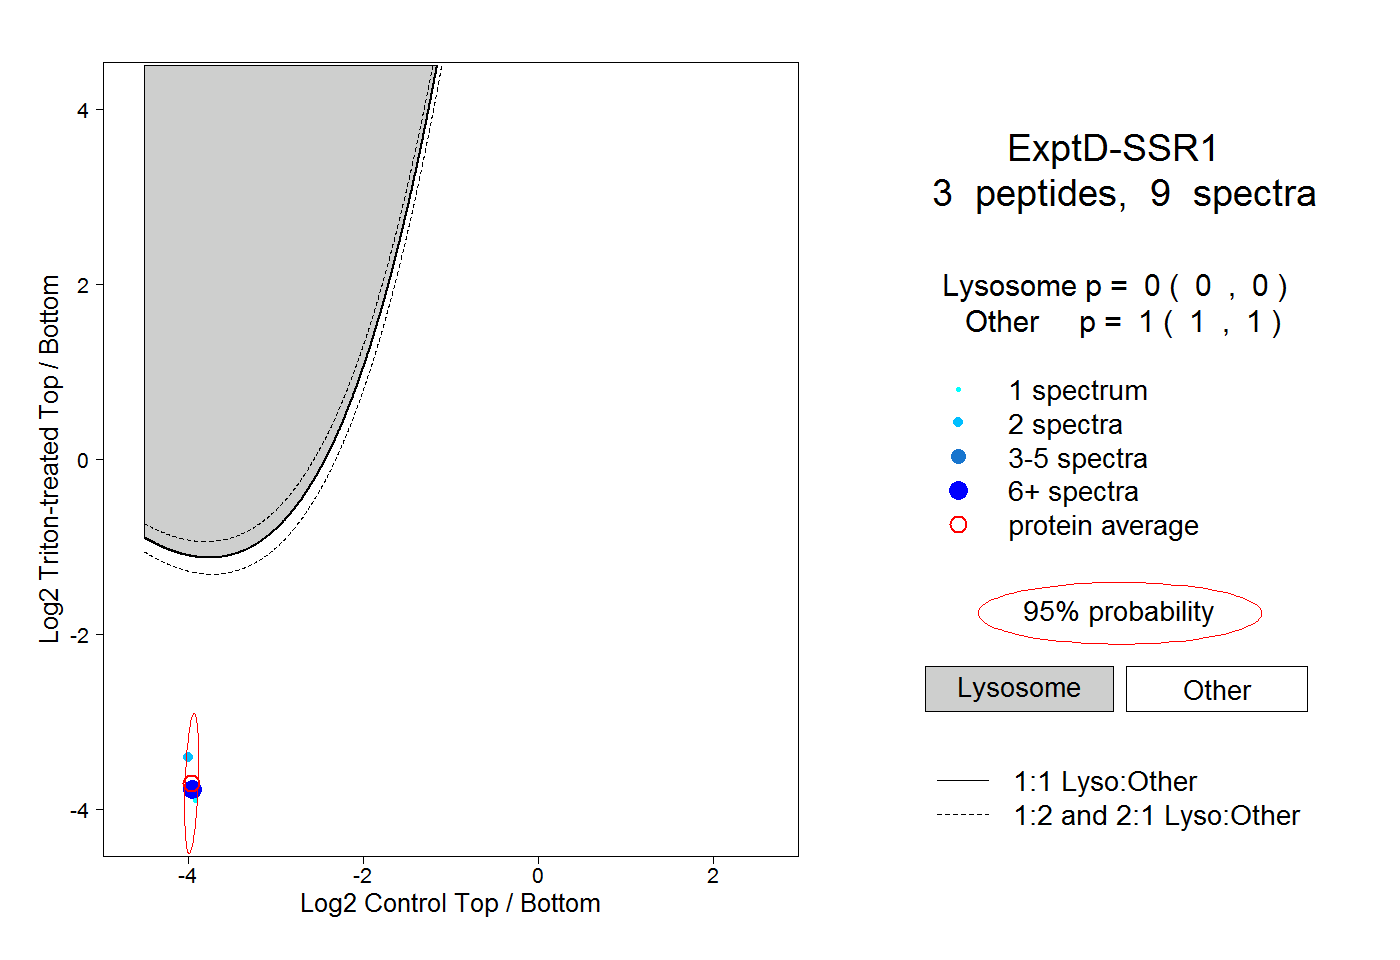
0.000 | 0.000
1.000 | 1.000