 79
79peptides
spectra
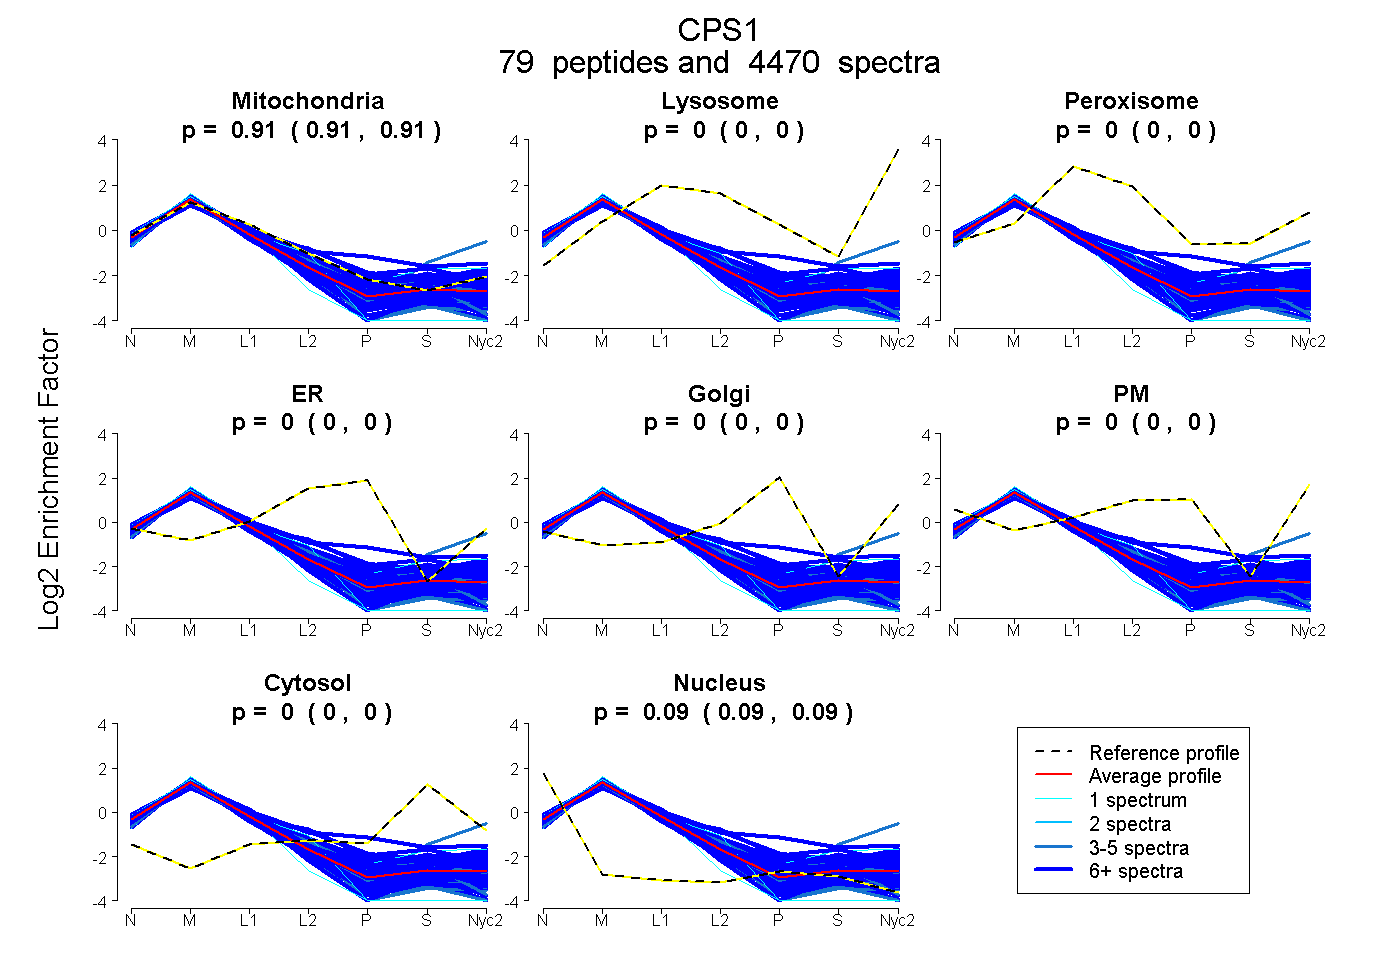
0.906 | 0.906
0.000 | 0.000
0.000 | 0.000
0.000 | 0.000
0.000 | 0.000
0.000 | 0.000
0.000 | 0.000
0.094 | 0.094
73peptides
spectra
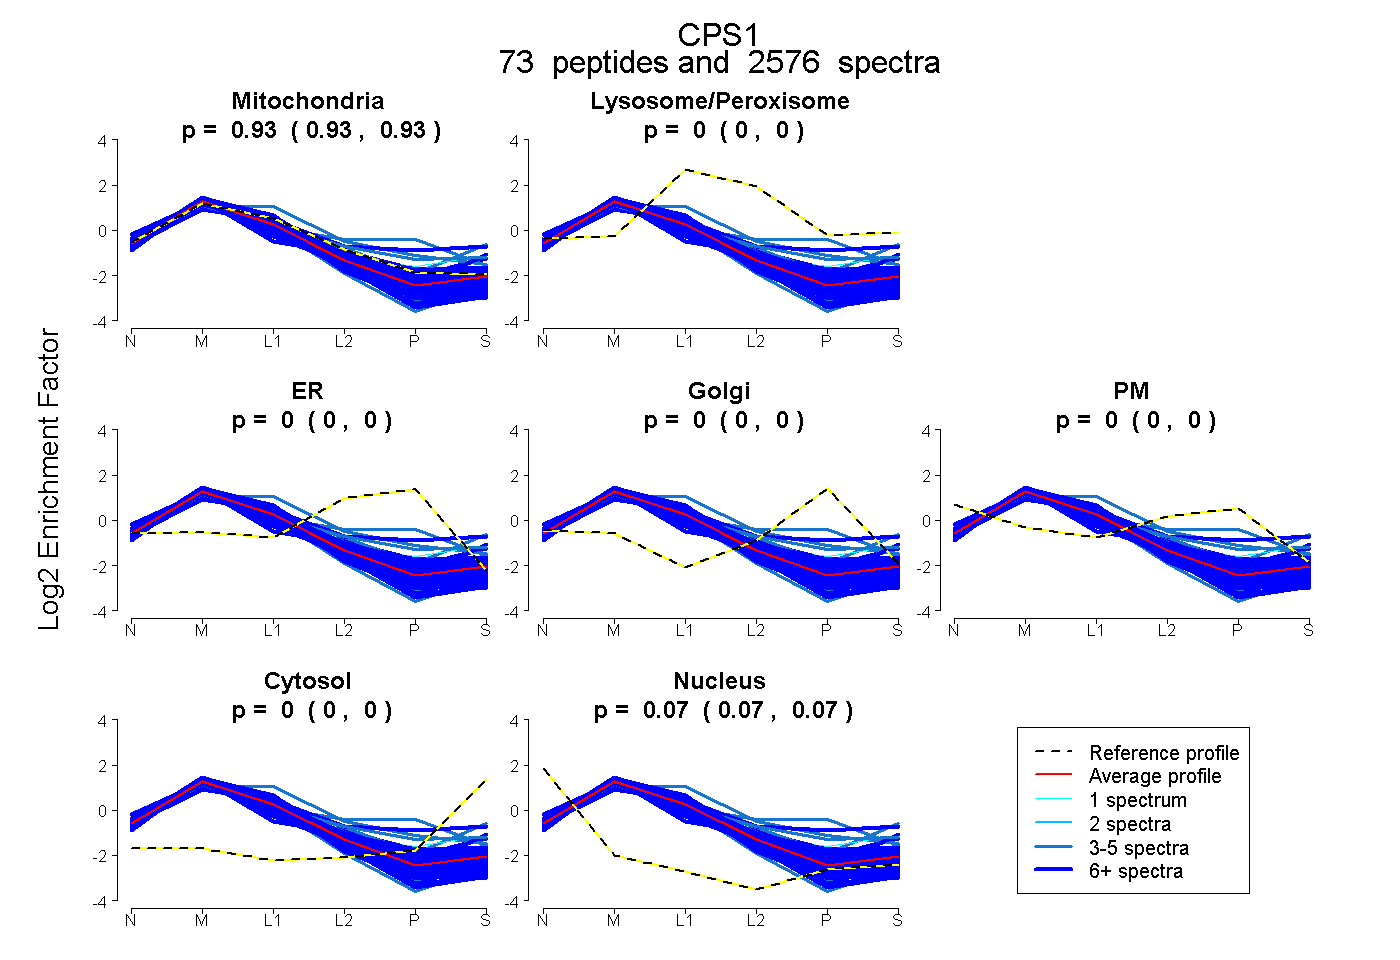
0.934 | 0.935
0.000 | 0.000
0.000 | 0.000
0.000 | 0.000
0.000 | 0.000
0.000 | 0.000
0.065 | 0.066
77peptides
spectra
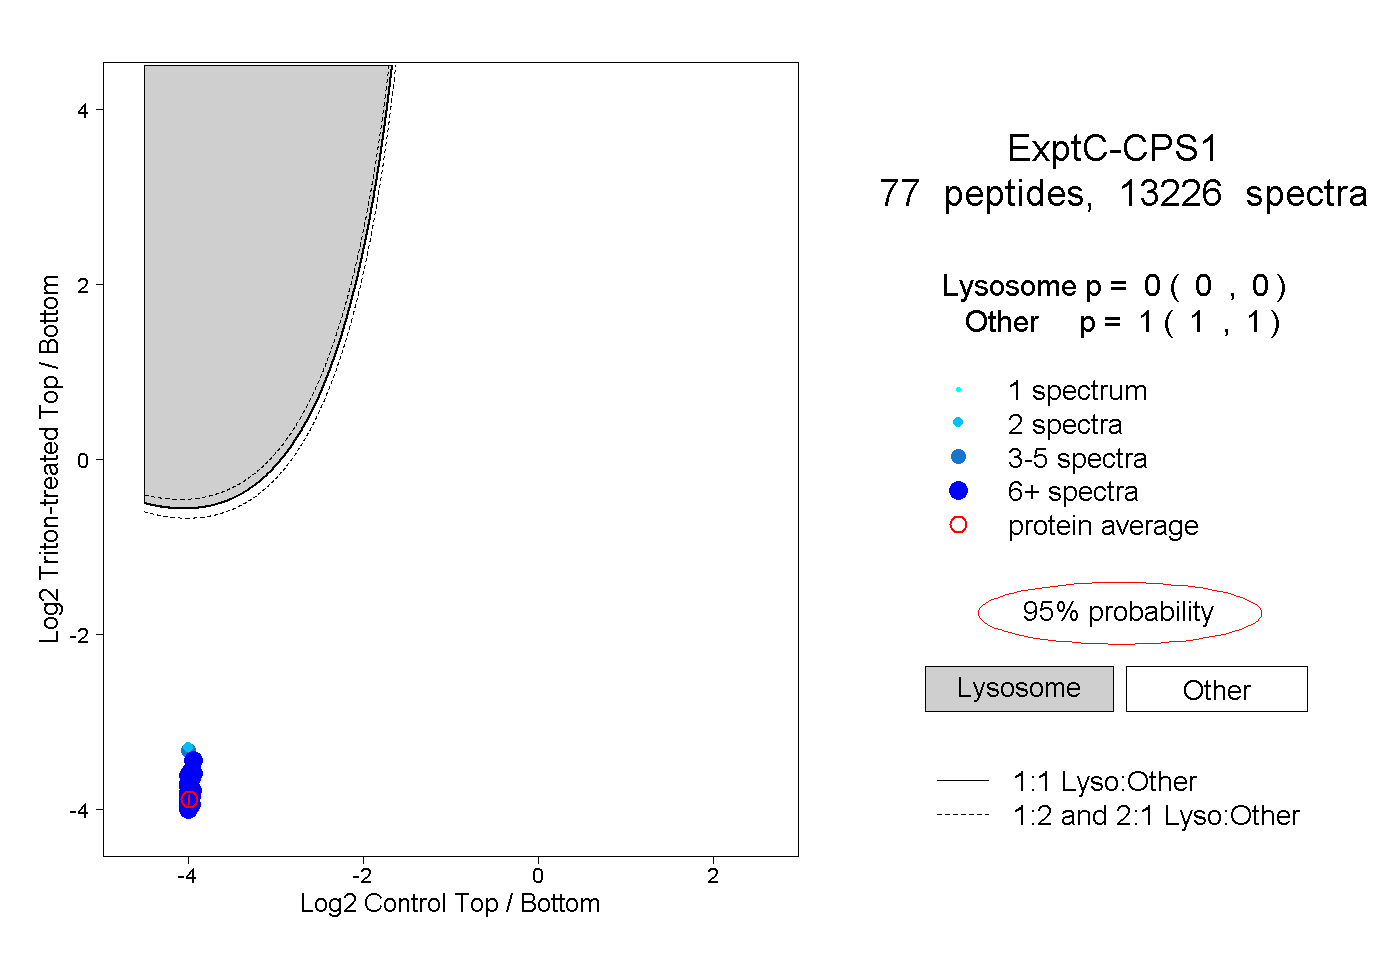
0.000 | 0.000
1.000 | 1.000
62peptides
spectra

0.000 | 0.000
1.000 | 1.000