 1
1peptide
spectrum

NA | NA
NA | NA
NA | NA
NA | NA
NA | NA
NA | NA
NA | NA
NA | NA
2peptides
spectra
0.000 | 0.203
0.008 | 0.339
0.000 | 0.537
0.000 | 0.599
0.000 | 0.152
0.000 | 0.283
0.000 | 0.090
| Plot | Mito | Lyso | Perox | ER | Golgi | PM | Cytosol | Nucleus | |||||
| Expt A |
1 peptide |
1 spectrum |
|
0.745 NA | NA |
0.000 NA | NA |
0.000 NA | NA |
0.000 NA | NA |
0.000 NA | NA |
0.000 NA | NA |
0.092 NA | NA |
0.163 NA | NA |
||
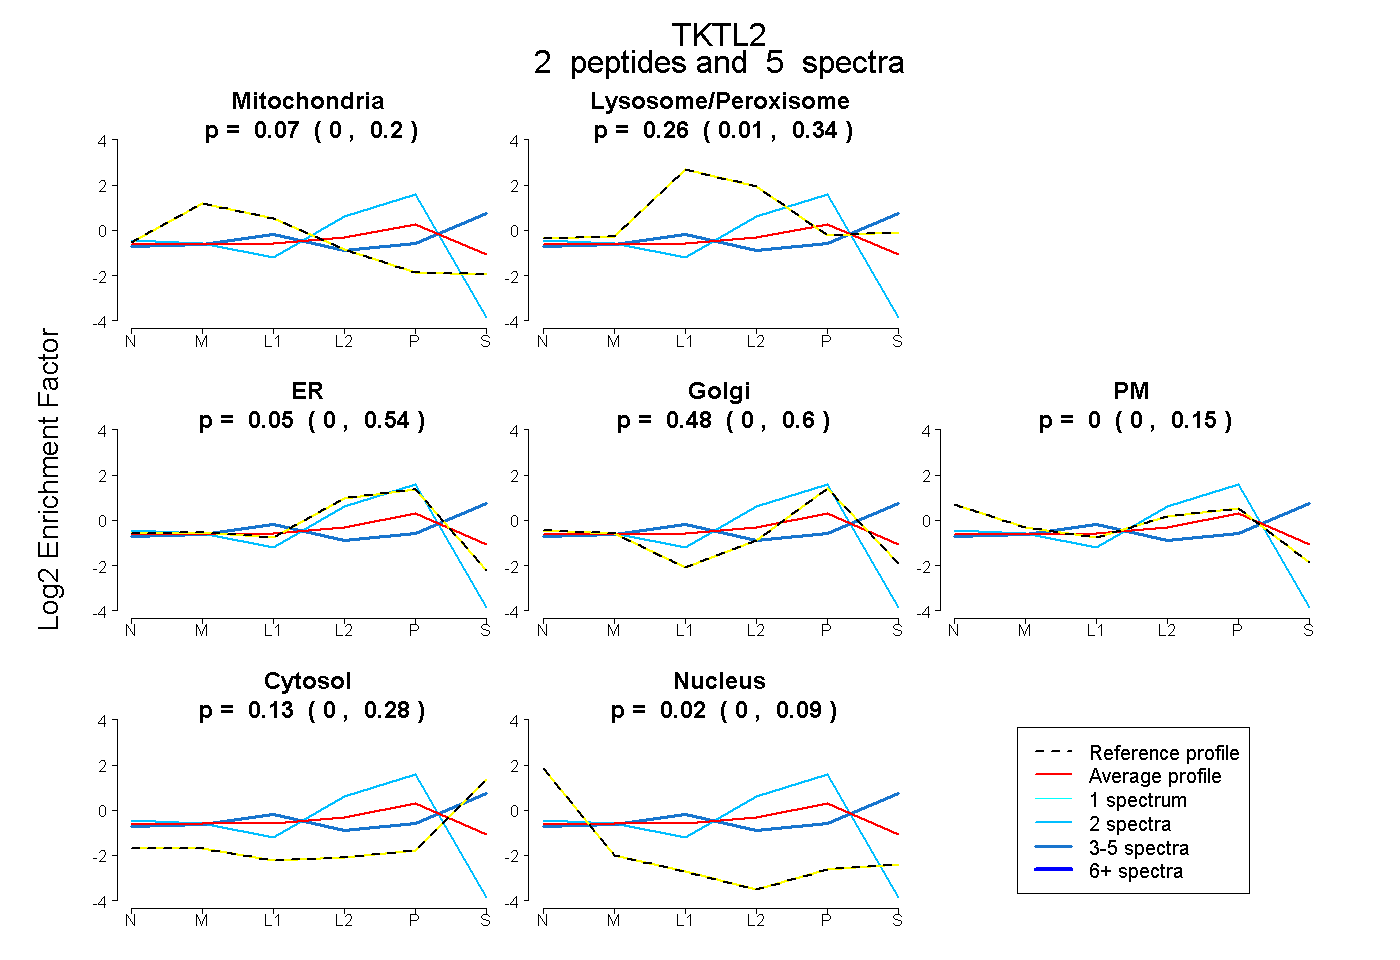
| Plot | Mito | Lyso or Perox | ER | Golgi | PM | Cytosol | Nucleus | ||||||
| Expt B |
2 peptides |
5 spectra |
|
0.072 0.000 | 0.203 |
0.257 0.008 | 0.339 |
0.048 0.000 | 0.537 |
0.476 0.000 | 0.599 |
0.000 0.000 | 0.152 |
0.131 0.000 | 0.283 |
0.016 0.000 | 0.090 |