 14
14peptides
spectra
0.000 | 0.000
0.000 | 0.000
0.000 | 0.000
0.000 | 0.000
0.019 | 0.041
0.000 | 0.000
0.295 | 0.313
0.652 | 0.674
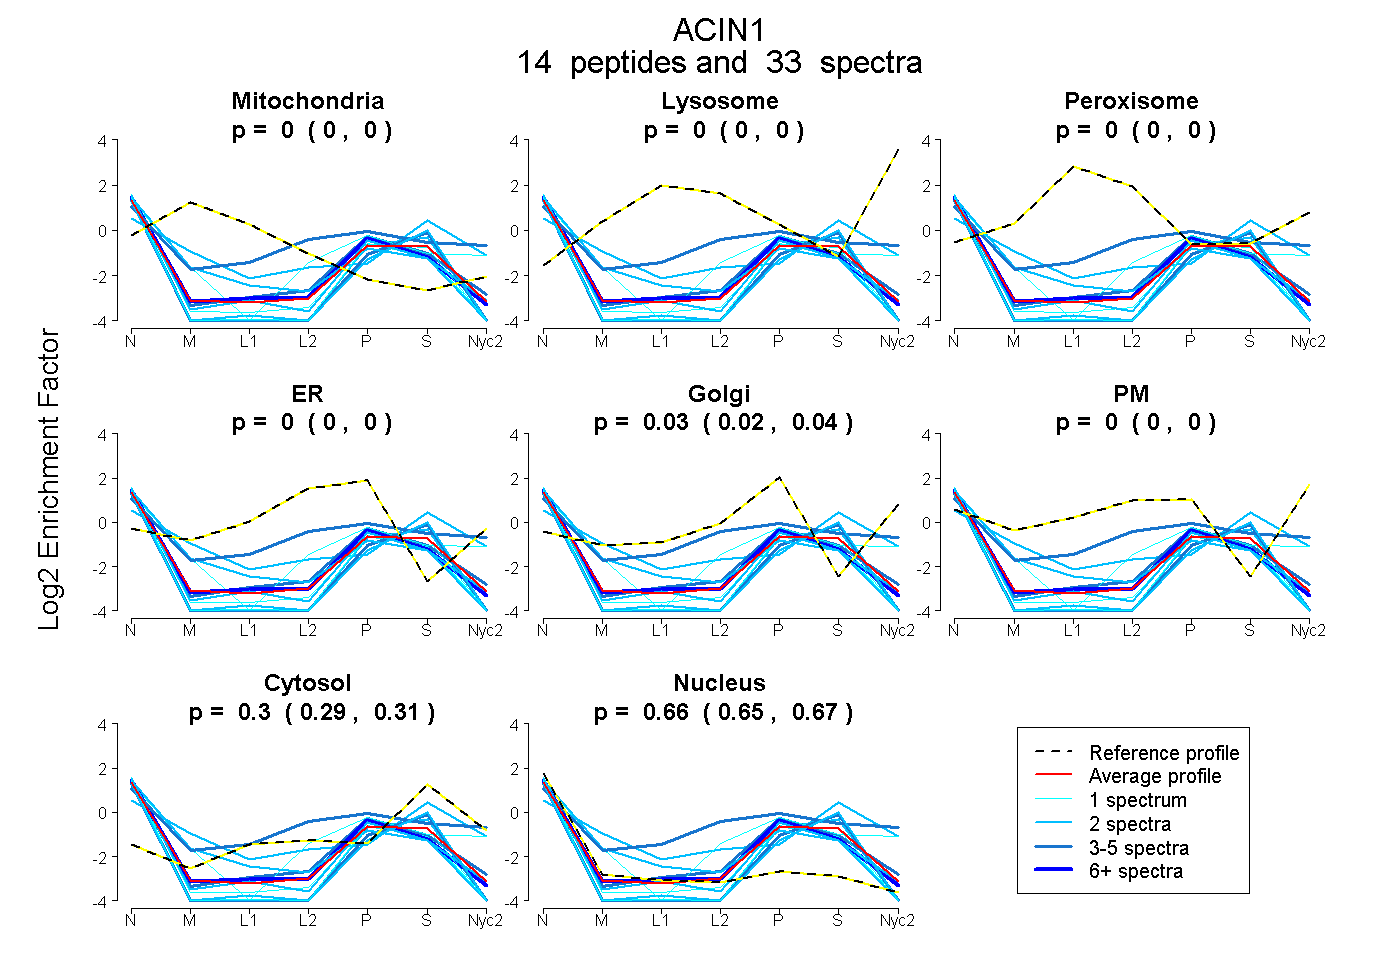
| Plot | Mito | Lyso | Perox | ER | Golgi | PM | Cytosol | Nucleus | |||||
| Expt A |
14 peptides |
33 spectra |
|
0.000 0.000 | 0.000 |
0.000 0.000 | 0.000 |
0.000 0.000 | 0.000 |
0.000 0.000 | 0.000 |
0.031 0.019 | 0.041 |
0.000 0.000 | 0.000 |
0.305 0.295 | 0.313 |
0.664 0.652 | 0.674 |
| 1 spectrum, AQEEPPAK | 0.000 | 0.000 | 0.000 | 0.000 | 0.000 | 0.000 | 0.201 | 0.799 | ||
| 1 spectrum, WPQSNPK | 0.000 | 0.000 | 0.000 | 0.000 | 0.000 | 0.000 | 0.188 | 0.812 | ||
| 2 spectra, APTCSASVR | 0.000 | 0.000 | 0.000 | 0.000 | 0.000 | 0.000 | 0.244 | 0.756 | ||
| 3 spectra, EQWAER | 0.000 | 0.000 | 0.000 | 0.000 | 0.131 | 0.000 | 0.235 | 0.634 | ||
| 1 spectrum, FLCADYAEQDELDYHR | 0.000 | 0.000 | 0.000 | 0.000 | 0.355 | 0.000 | 0.190 | 0.455 | ||
| 5 spectra, VHANPHDR | 0.000 | 0.000 | 0.000 | 0.070 | 0.000 | 0.359 | 0.350 | 0.221 | ||
| 2 spectra, SGVSITIDDPVR | 0.035 | 0.000 | 0.000 | 0.000 | 0.151 | 0.000 | 0.171 | 0.643 | ||
| 2 spectra, TALHGVK | 0.000 | 0.000 | 0.000 | 0.000 | 0.007 | 0.000 | 0.185 | 0.808 | ||
| 2 spectra, EEELLR | 0.117 | 0.000 | 0.000 | 0.000 | 0.000 | 0.094 | 0.576 | 0.213 | ||
| 4 spectra, SAPLLPLTR | 0.000 | 0.000 | 0.000 | 0.000 | 0.000 | 0.000 | 0.247 | 0.753 | ||
| 1 spectrum, GVQAGNSDTEGGQPGR | 0.000 | 0.000 | 0.000 | 0.000 | 0.000 | 0.000 | 0.141 | 0.859 | ||
| 2 spectra, VSEESVLPLAQR | 0.000 | 0.000 | 0.000 | 0.000 | 0.000 | 0.000 | 0.250 | 0.750 | ||
| 6 spectra, LLDDLFR | 0.000 | 0.000 | 0.000 | 0.000 | 0.104 | 0.000 | 0.192 | 0.704 | ||
| 1 spectrum, GLLVDRPSEAK | 0.000 | 0.000 | 0.000 | 0.000 | 0.000 | 0.000 | 0.140 | 0.860 |
| Plot | Mito | Lyso or Perox | ER | Golgi | PM | Cytosol | Nucleus | ||||||
| Expt B |
3 peptides |
6 spectra |
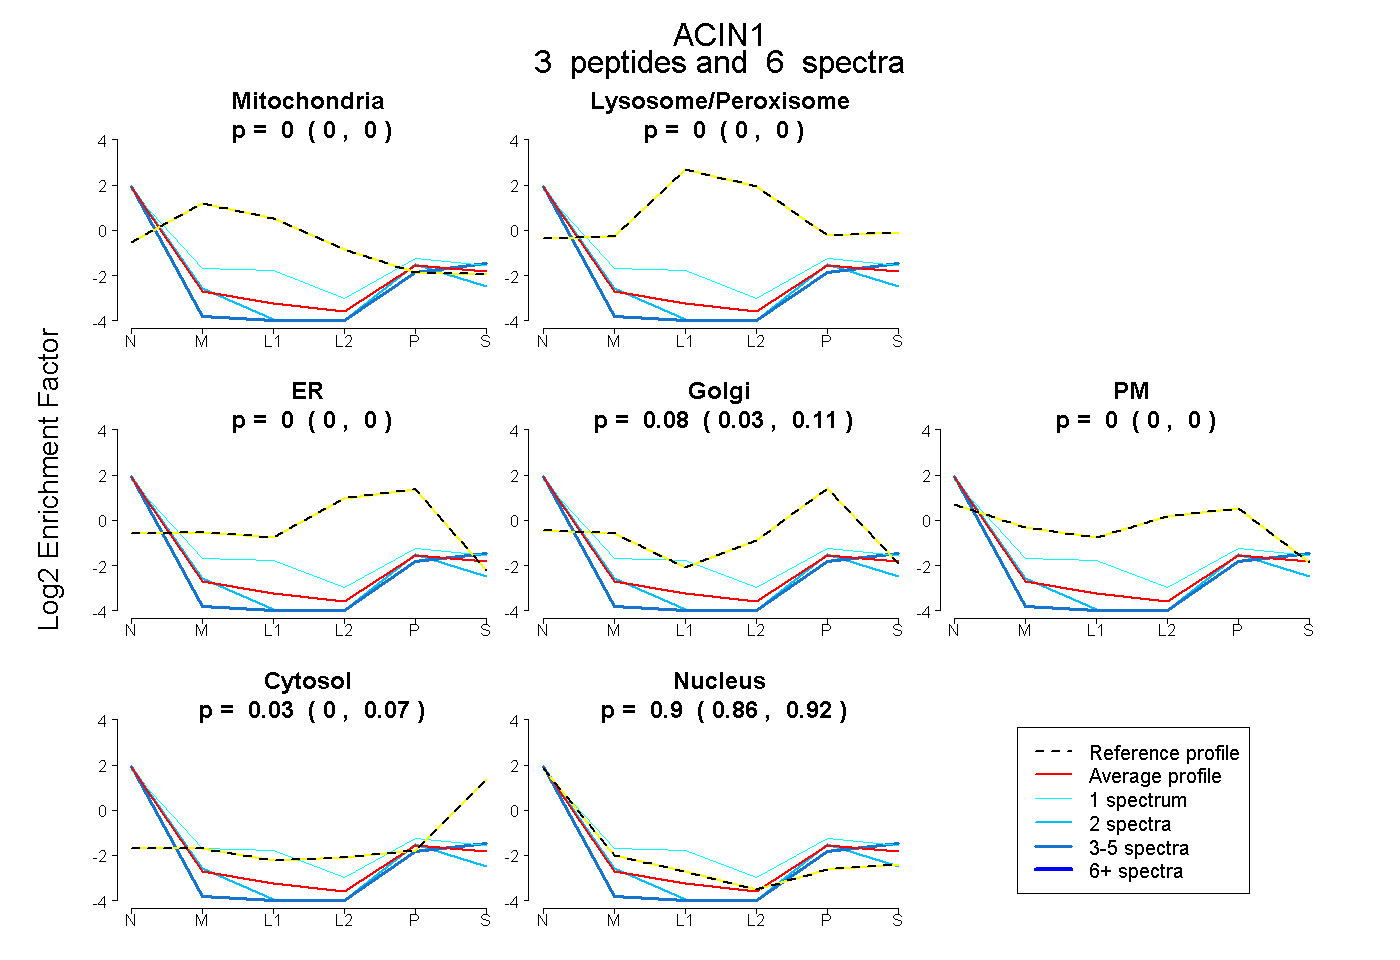 |
0.000 0.000 | 0.000 |
0.000 0.000 | 0.000 |
0.000 0.000 | 0.000 |
0.077 0.027 | 0.113 |
0.000 0.000 | 0.000 |
0.028 0.000 | 0.073 |
0.895 0.859 | 0.924 |
|||
| Plot | Lyso | Other | |||||||||||
| Expt C |
1 peptide |
2 spectra |
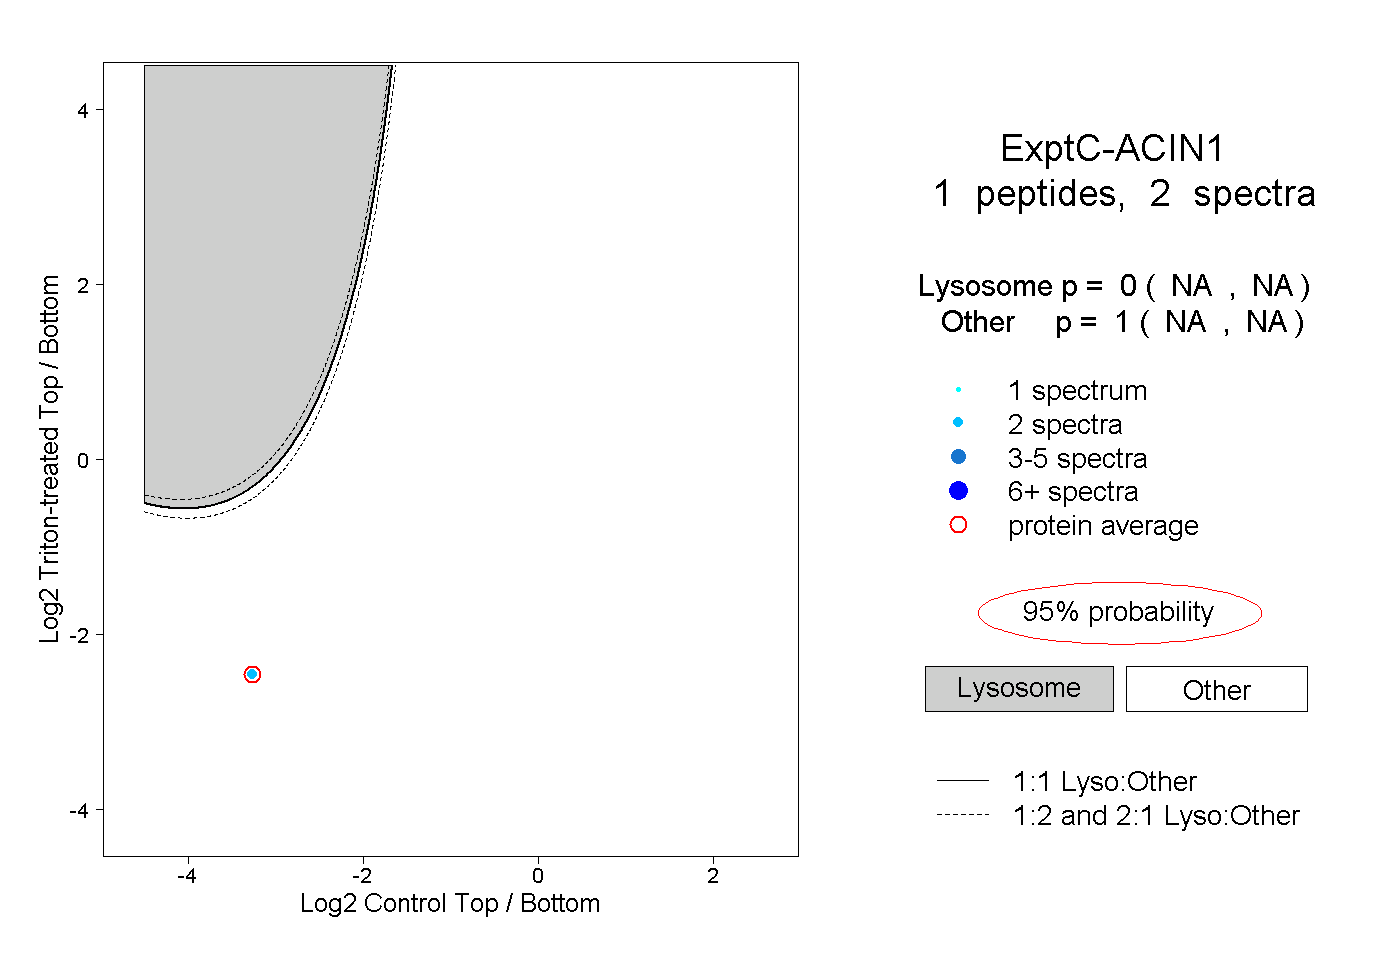 |
0.000 NA | NA |
1.000 NA | NA |
||||||||
| Plot | Lyso | Other | |||||||||||
| Expt D |
1 peptide |
3 spectra |
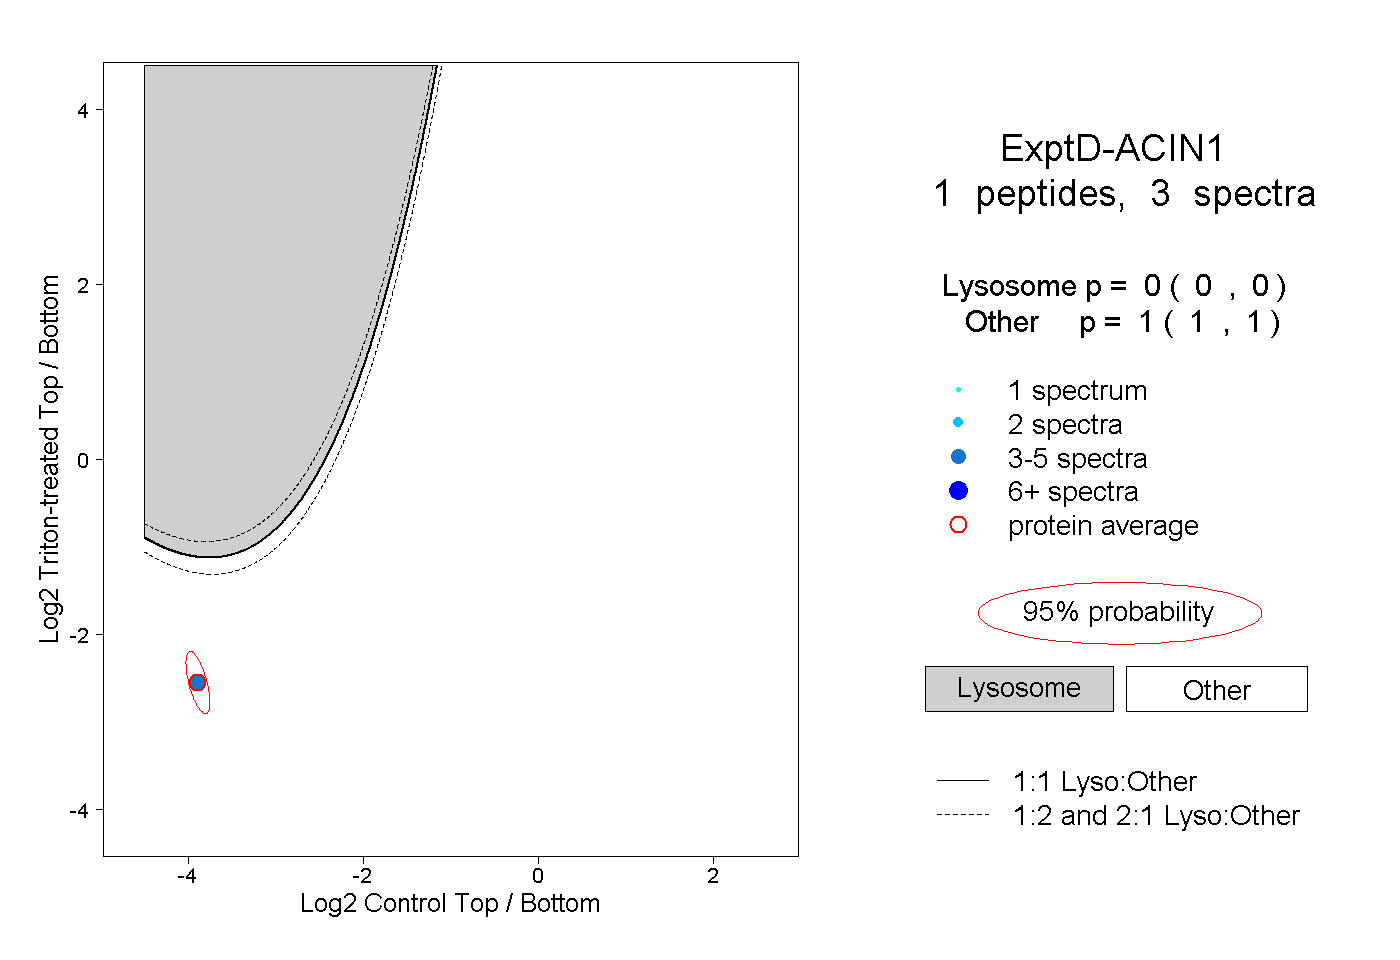 |
0.000 0.000 | 0.000 |
1.000 1.000 | 1.000 |