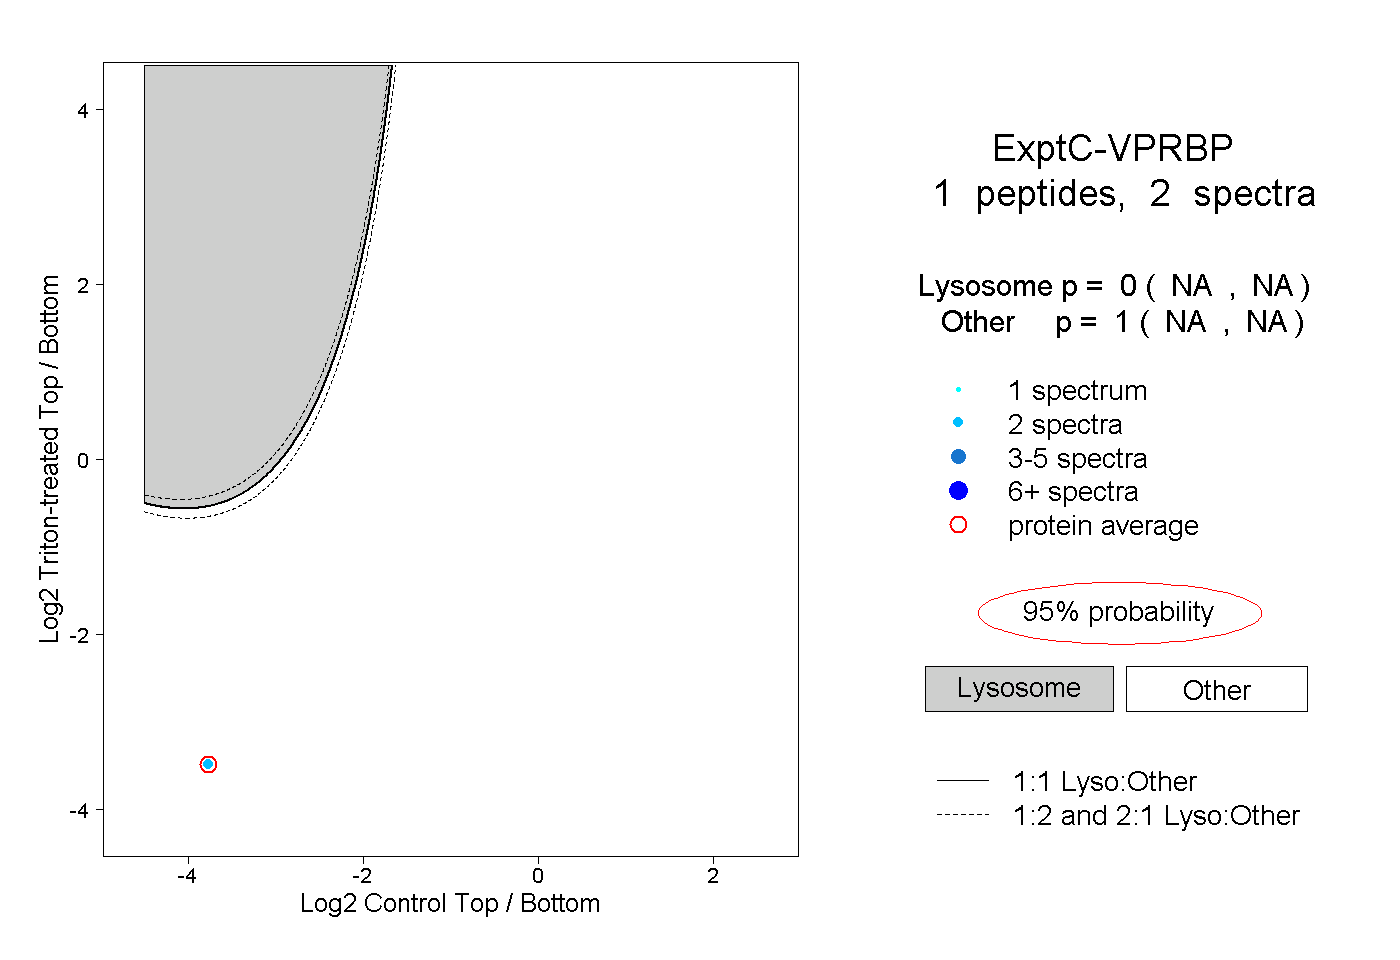
VPRBP
[ENSRNOP00000018932]
Main page
| | | Plot |
Mito |
Lyso |
|
Perox |
ER |
Golgi |
PM |
Cytosol |
Nucleus |
|
| Expt A |
 4
4
peptides |
7
spectra |
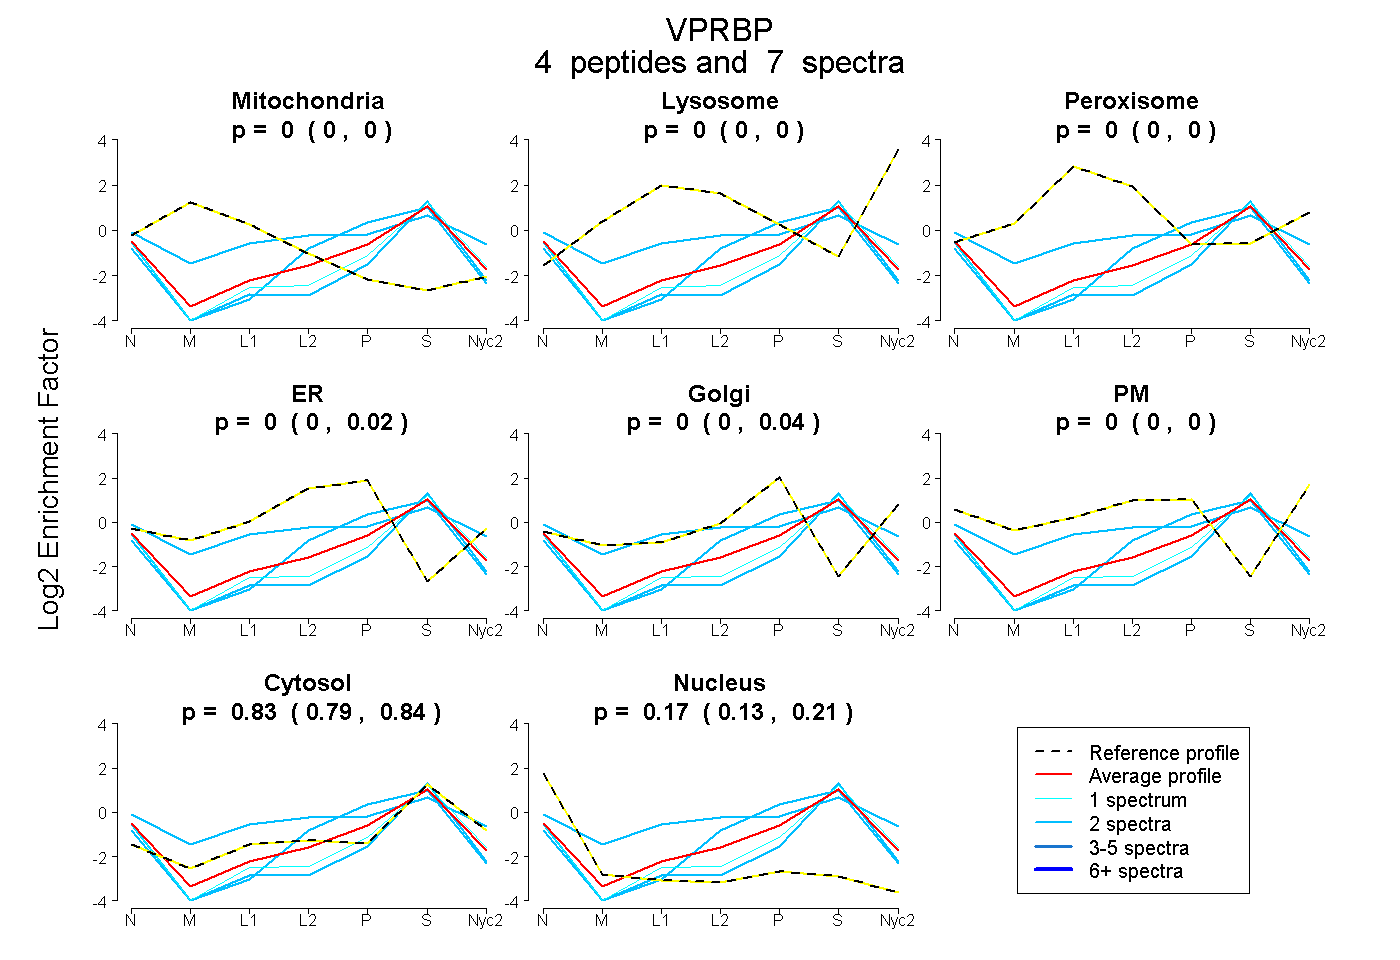 |
0.000
0.000 | 0.000 |
0.000
0.000 | 0.000 |
|
0.000
0.000 | 0.000 |
0.000
0.000 | 0.023 |
0.000
0.000 | 0.038 |
0.000
0.000 | 0.000 |
0.828
0.786 | 0.842 |
0.172
0.129 | 0.206 |
|
| | | Plot |
Mito |
|
Lyso or Perox |
|
ER |
Golgi |
PM |
Cytosol |
Nucleus |
|
| Expt B |
2
peptides |
5
spectra |
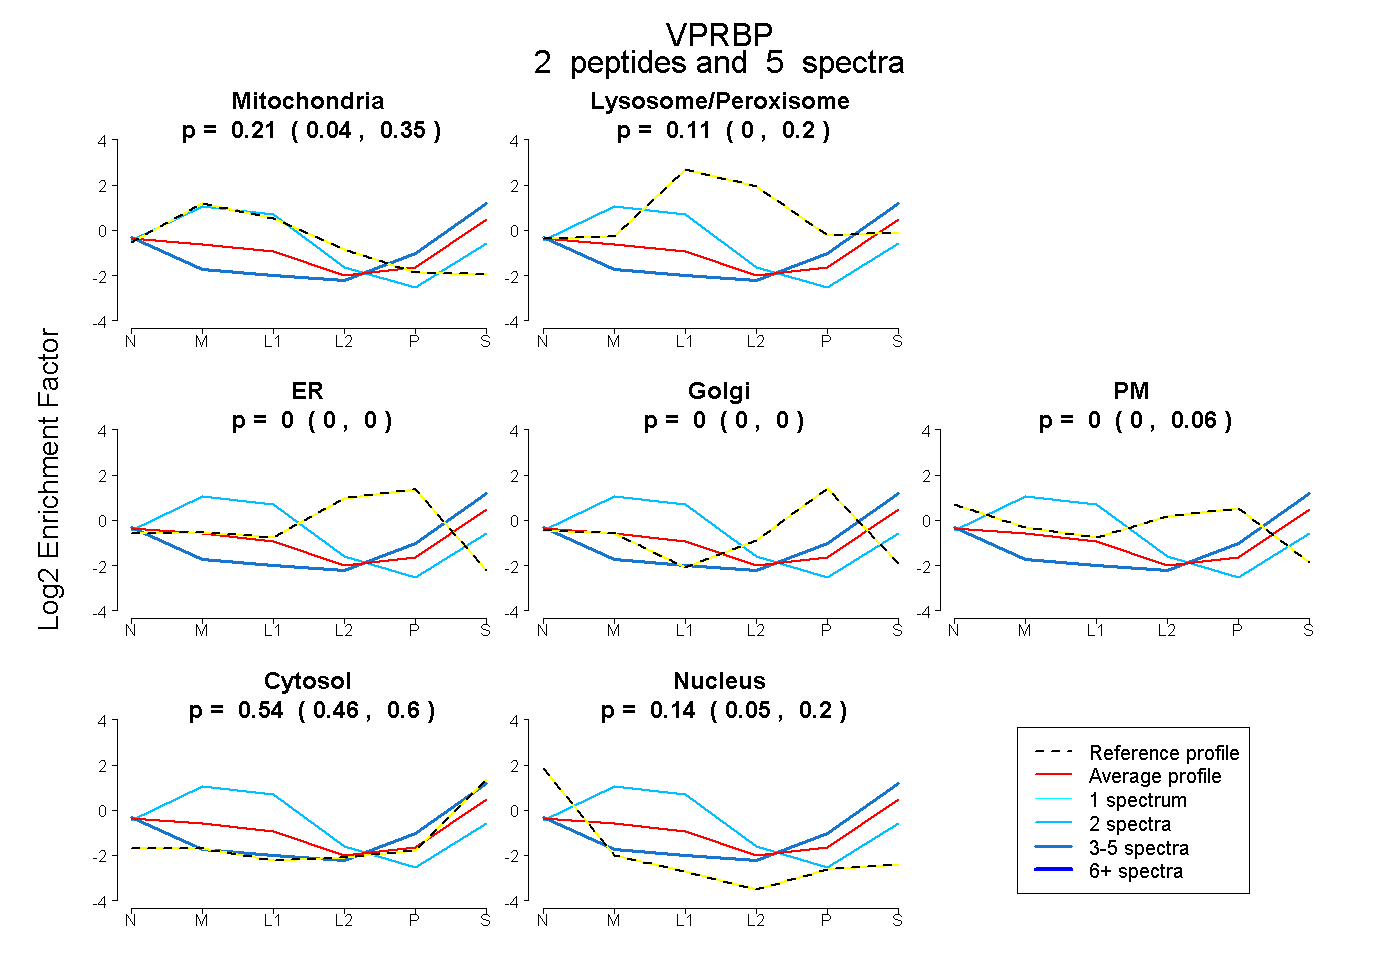 |
0.215
0.037 | 0.353 |
|
0.109
0.000 | 0.199 |
|
0.000
0.000 | 0.000 |
0.000
0.000 | 0.000 |
0.000
0.000 | 0.062 |
0.536
0.456 | 0.601 |
0.140
0.054 | 0.205 |
|
| 2 spectra, NHLISK |
0.827 |
|
0.000 |
|
0.000 |
0.000 |
0.000 |
0.173 |
0.000 |
|
| 3 spectra, FRPISVFR |
0.000 |
|
0.000 |
|
0.000 |
0.000 |
0.130 |
0.757 |
0.113 |
|
| | | Plot |
|
Lyso |
|
|
|
|
|
|
|
Other |
| Expt C |
1
peptide |
2
spectra |
 |
|
0.000
NA | NA |
|
|
|
|
|
|
|
1.000
NA | NA |