12
12peptides
spectra
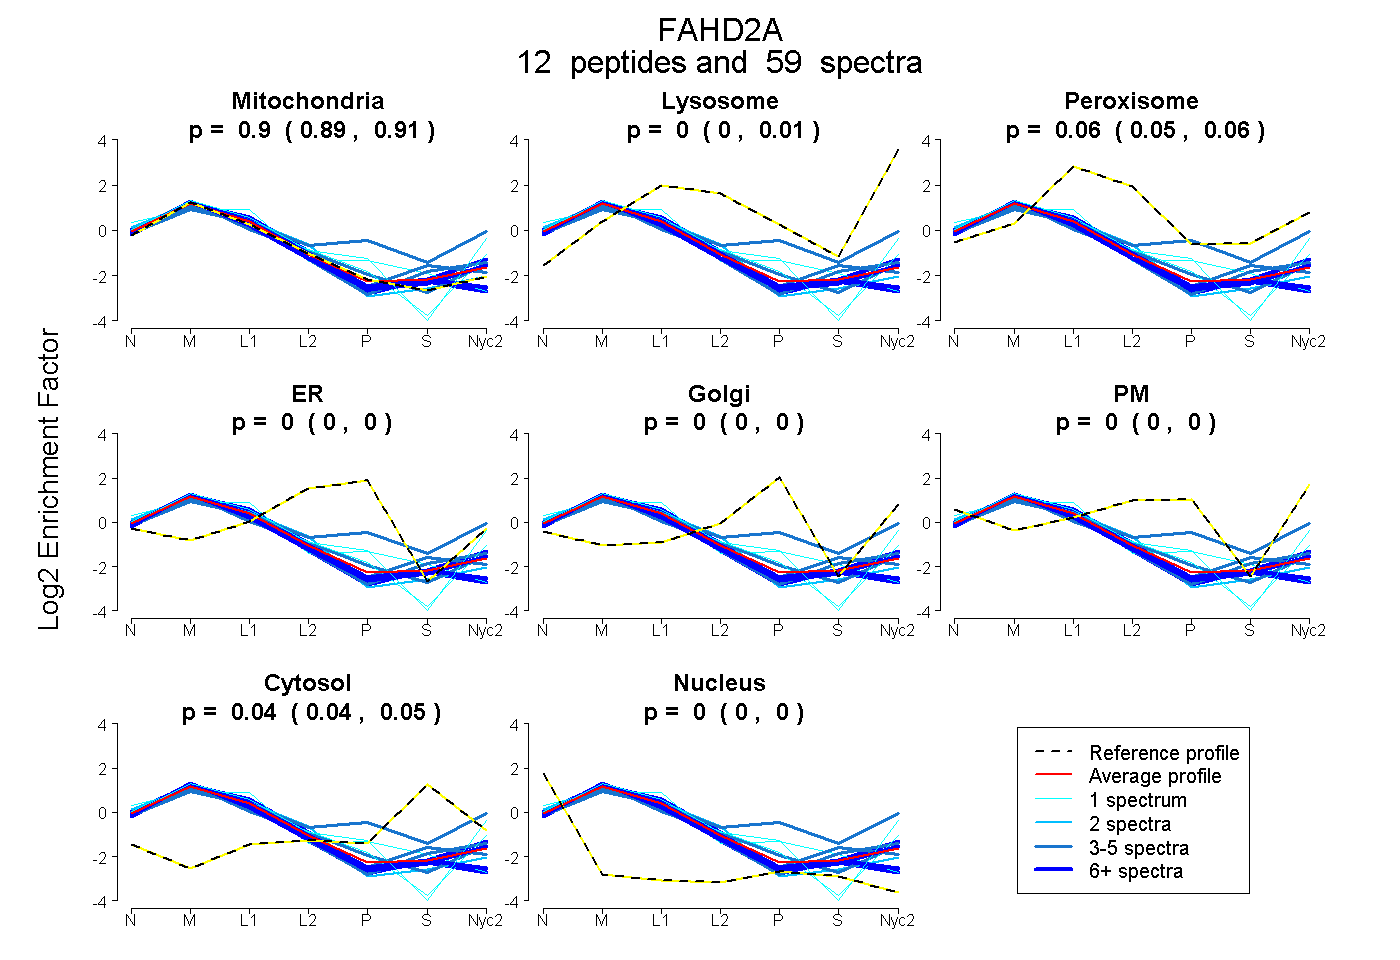
0.893 | 0.907
0.000 | 0.009
0.047 | 0.059
0.000 | 0.000
0.000 | 0.000
0.000 | 0.000
0.040 | 0.046
0.000 | 0.000
10peptides
spectra
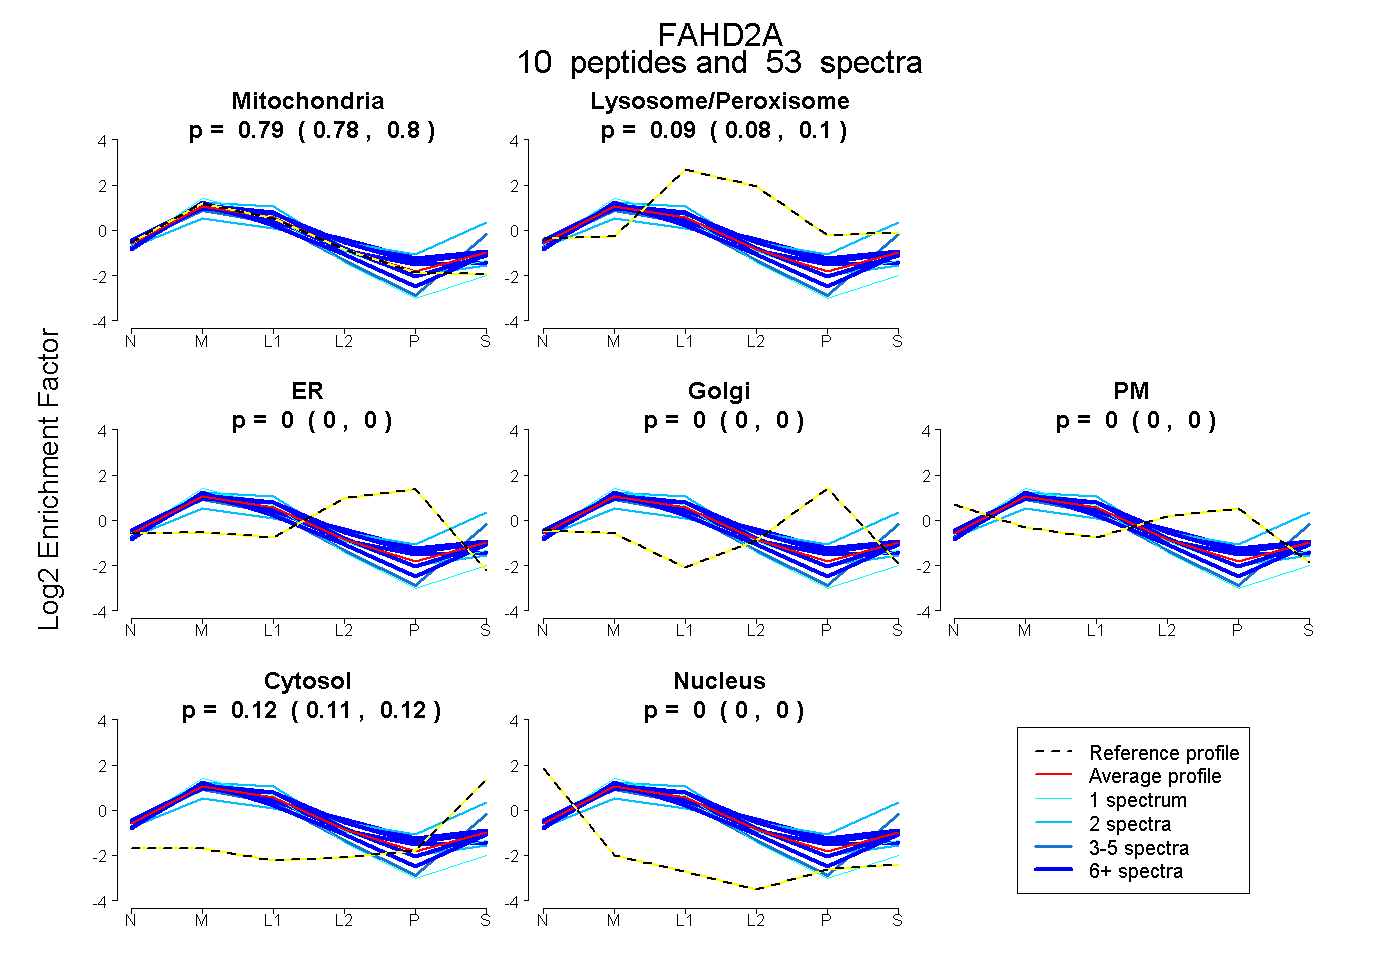
0.780 | 0.800
0.084 | 0.098
0.000 | 0.000
0.000 | 0.000
0.000 | 0.000
0.111 | 0.123
0.000 | 0.000
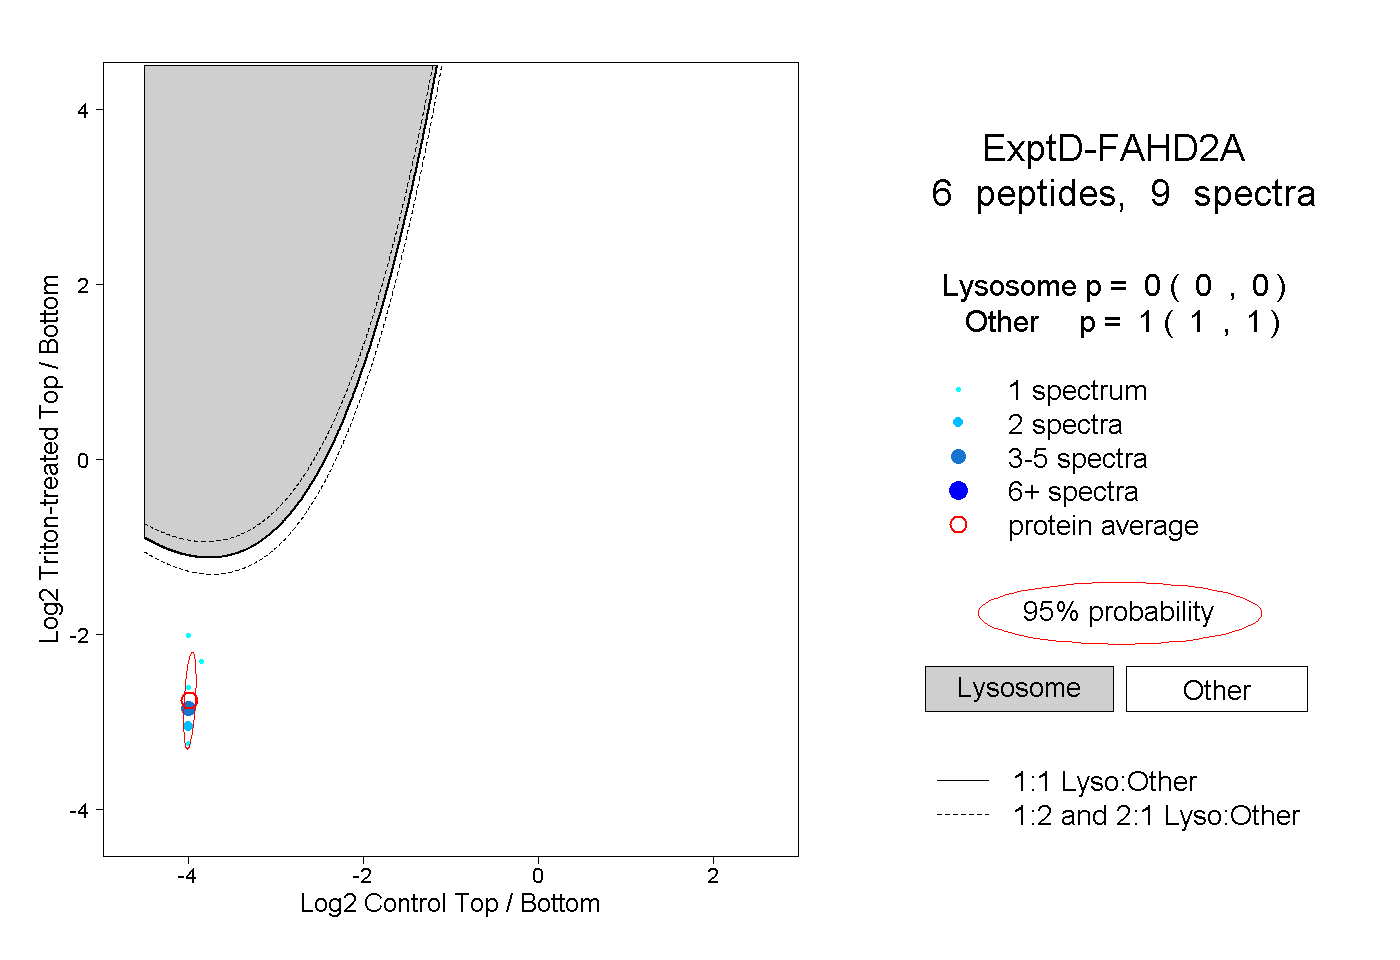
13peptides
spectra
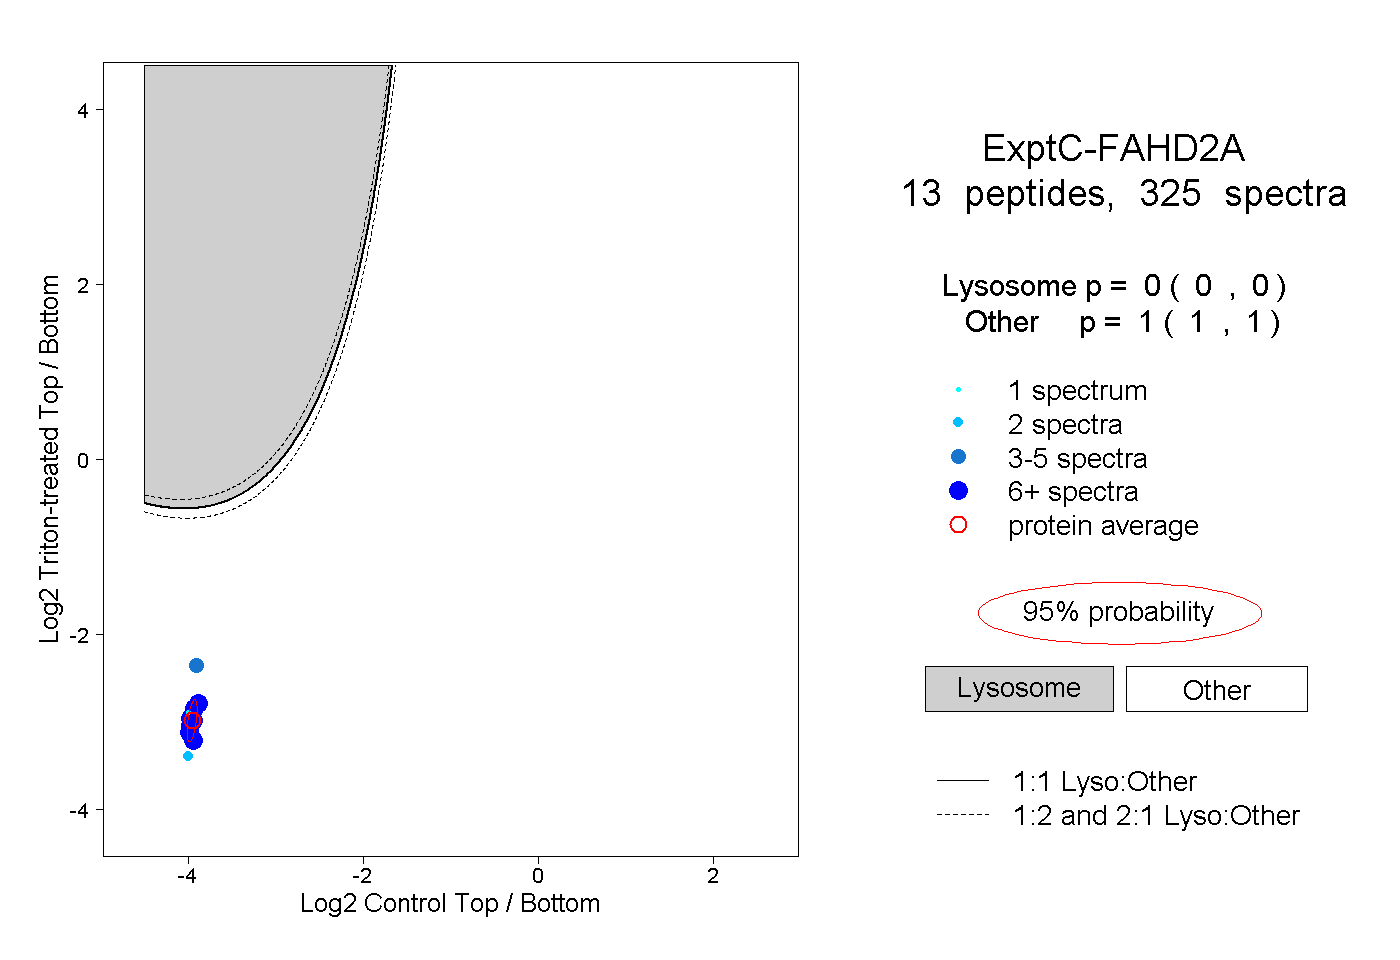
0.000 | 0.000
1.000 | 1.000