 12
12peptides
spectra
0.893 | 0.907
0.000 | 0.009
0.047 | 0.059
0.000 | 0.000
0.000 | 0.000
0.000 | 0.000
0.040 | 0.046
0.000 | 0.000
| Plot | Mito | Lyso | Perox | ER | Golgi | PM | Cytosol | Nucleus | |||||
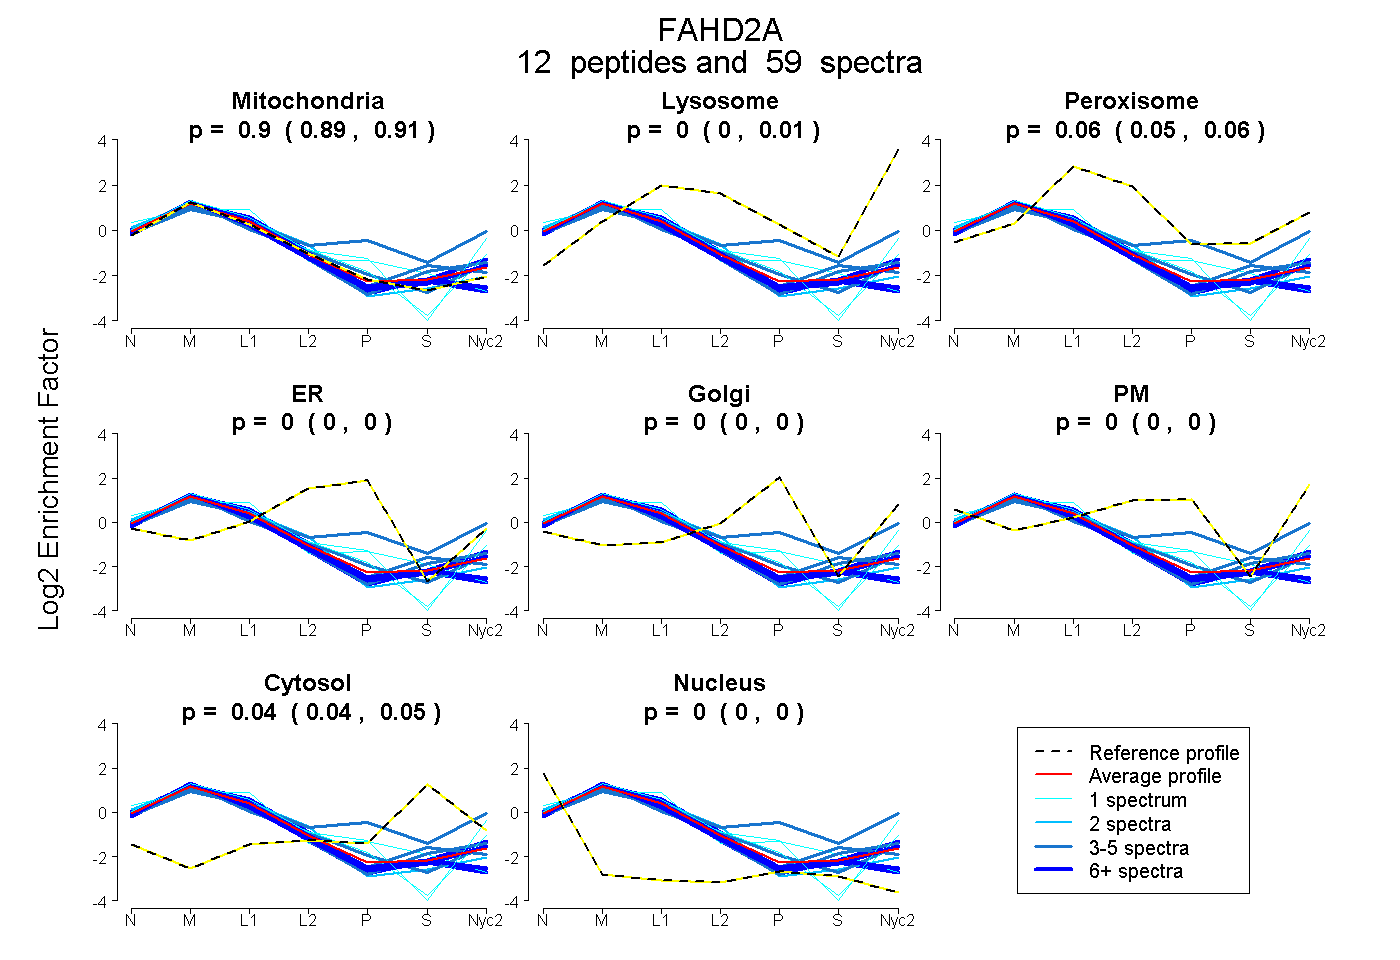
| Expt A |
12 peptides |
59 spectra |
|
0.900 0.893 | 0.907 |
0.000 0.000 | 0.009 |
0.056 0.047 | 0.059 |
0.000 0.000 | 0.000 |
0.000 0.000 | 0.000 |
0.000 0.000 | 0.000 |
0.043 0.040 | 0.046 |
0.000 0.000 | 0.000 |
| 5 spectra, GETALSVAR | 0.886 | 0.000 | 0.038 | 0.000 | 0.000 | 0.000 | 0.076 | 0.000 | ||
| 10 spectra, ALAAQLPLIPR | 0.921 | 0.040 | 0.000 | 0.000 | 0.000 | 0.000 | 0.039 | 0.000 | ||
| 5 spectra, SQVTFLAPVTRPDK | 0.863 | 0.000 | 0.011 | 0.000 | 0.000 | 0.000 | 0.126 | 0.000 | ||
| 7 spectra, VICVGLNYADHCQEQNVR | 0.972 | 0.000 | 0.000 | 0.000 | 0.000 | 0.000 | 0.011 | 0.016 | ||
| 7 spectra, TMVQFLER | 0.952 | 0.016 | 0.000 | 0.000 | 0.000 | 0.000 | 0.032 | 0.000 | ||
| 3 spectra, QWLLGK | 0.895 | 0.000 | 0.000 | 0.000 | 0.000 | 0.100 | 0.000 | 0.005 | ||
| 1 spectrum, VNGEIVQSSNTNQMVFK | 0.707 | 0.001 | 0.000 | 0.000 | 0.000 | 0.292 | 0.000 | 0.000 | ||
| 1 spectrum, TFDTFCPLGPALVTK | 0.837 | 0.000 | 0.000 | 0.000 | 0.000 | 0.163 | 0.000 | 0.000 | ||
| 12 spectra, ATDVMAYVAGFTVAHDVSAR | 0.994 | 0.000 | 0.000 | 0.000 | 0.000 | 0.000 | 0.000 | 0.006 | ||
| 1 spectrum, DTIADPHNLK | 0.812 | 0.000 | 0.103 | 0.000 | 0.000 | 0.000 | 0.000 | 0.085 | ||
| 2 spectra, EVDWEVEMAVVIGK | 0.963 | 0.000 | 0.027 | 0.000 | 0.000 | 0.000 | 0.000 | 0.009 | ||
| 5 spectra, NPIIFSK | 0.501 | 0.189 | 0.001 | 0.000 | 0.102 | 0.123 | 0.084 | 0.000 |
| Plot | Mito | Lyso or Perox | ER | Golgi | PM | Cytosol | Nucleus | ||||||
| Expt B |
10 peptides |
53 spectra |
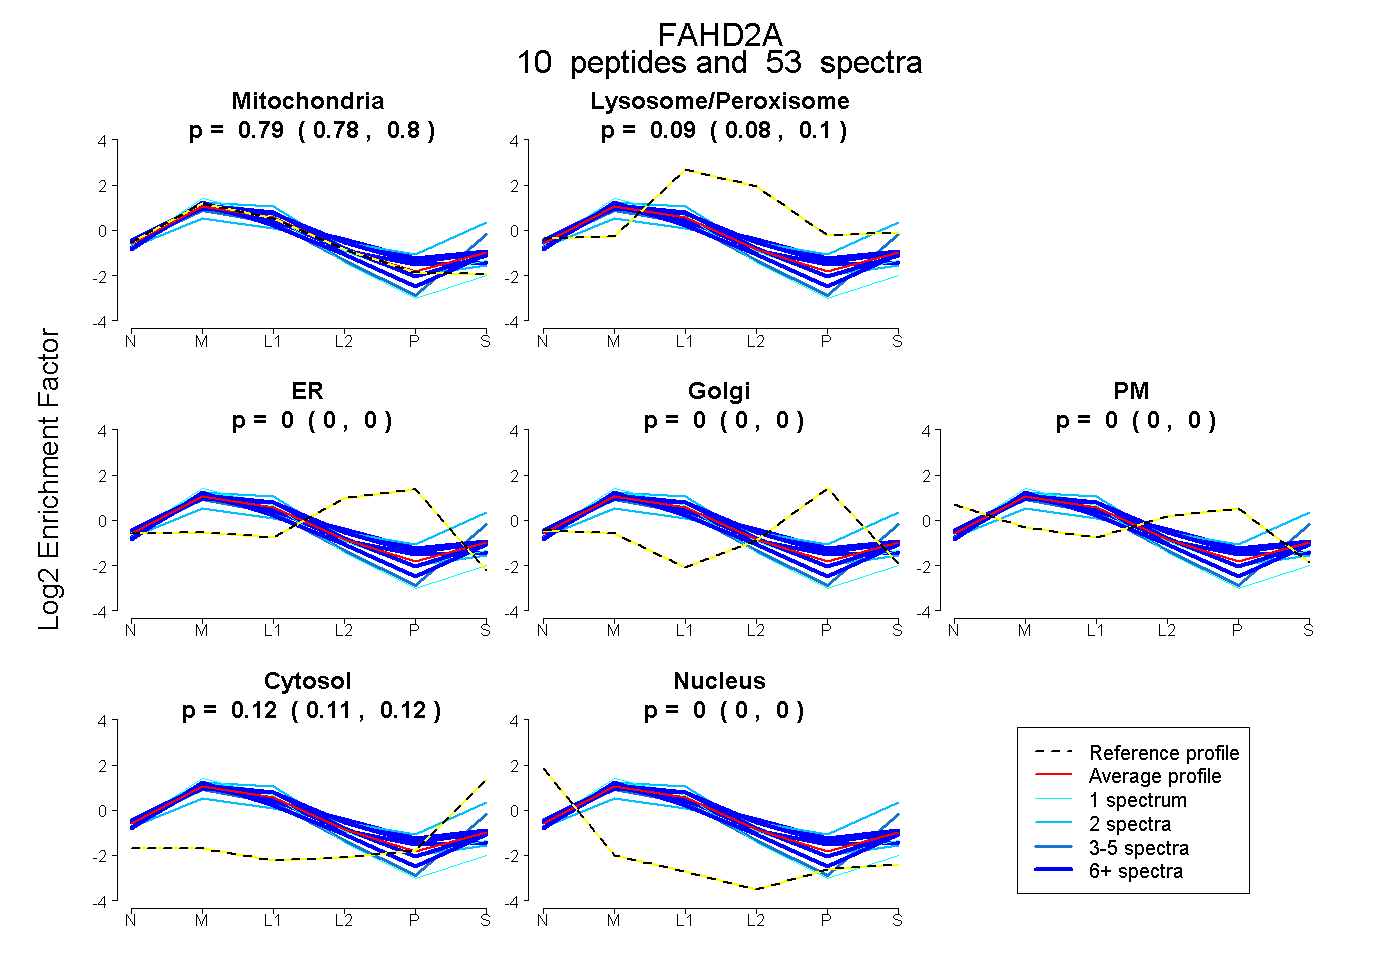 |
0.791 0.780 | 0.800 |
0.092 0.084 | 0.098 |
0.000 0.000 | 0.000 |
0.000 0.000 | 0.000 |
0.000 0.000 | 0.000 |
0.118 0.111 | 0.123 |
0.000 0.000 | 0.000 |
|||
| Plot | Lyso | Other | |||||||||||
| Expt C |
13 peptides |
325 spectra |
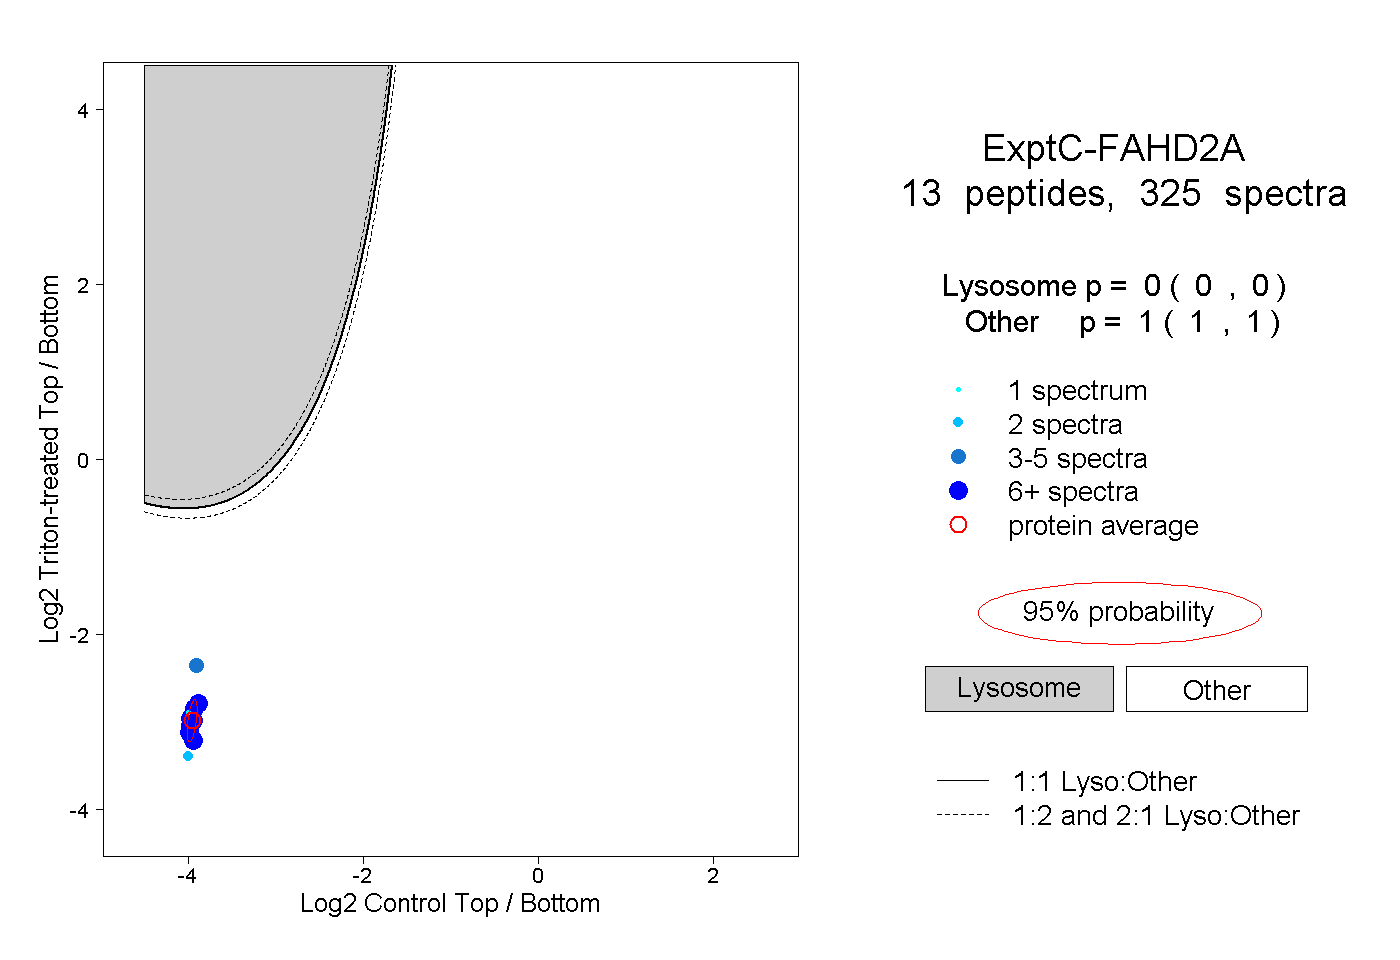 |
0.000 0.000 | 0.000 |
1.000 1.000 | 1.000 |
||||||||
| Plot | Lyso | Other | |||||||||||
| Expt D |
6 peptides |
9 spectra |
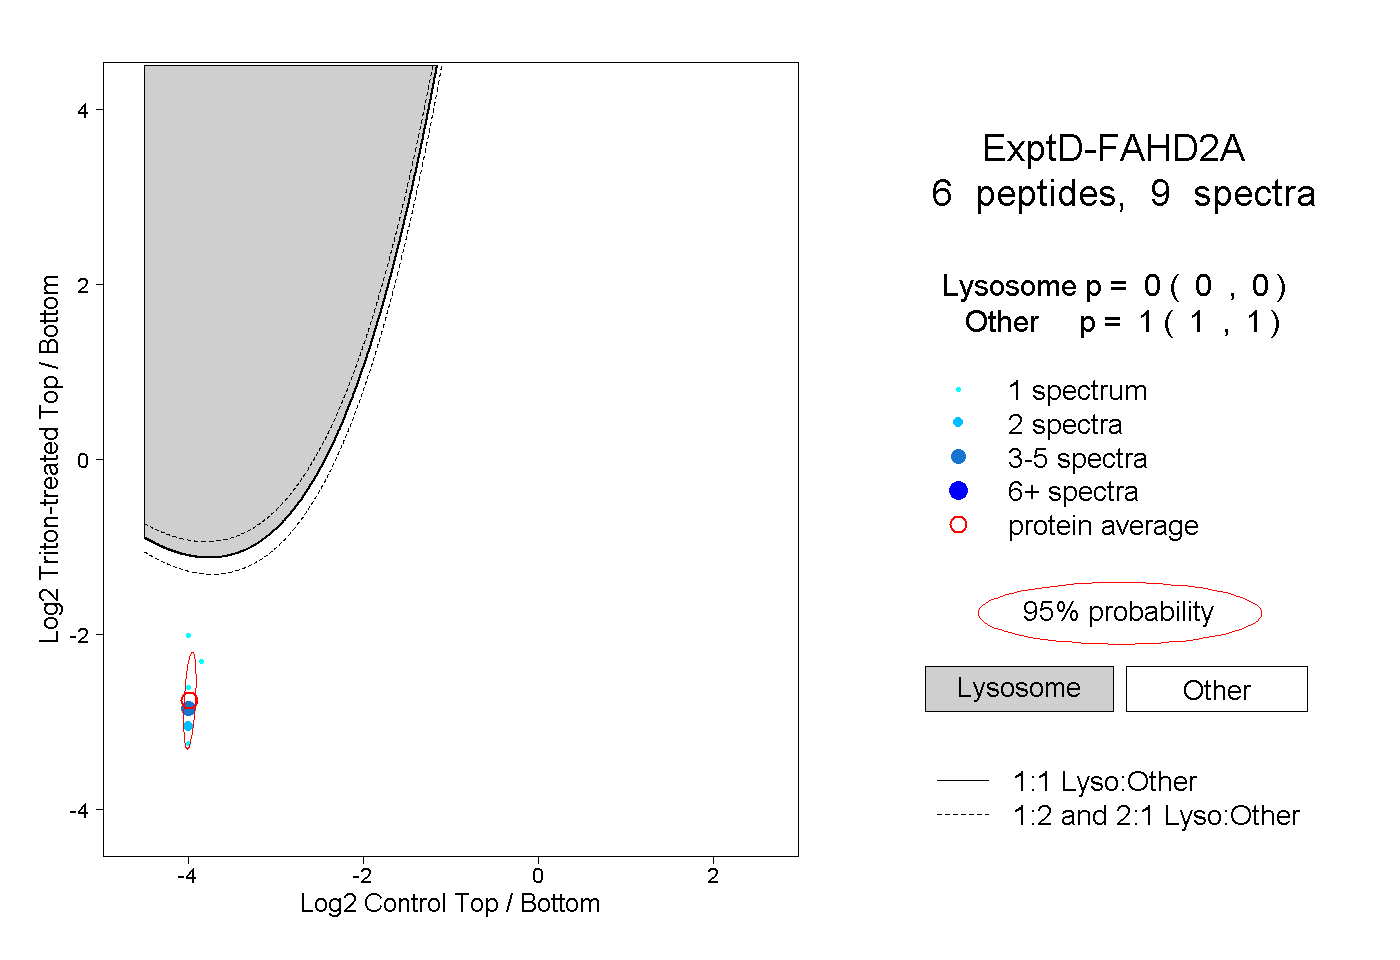 |
0.000 0.000 | 0.000 |
1.000 1.000 | 1.000 |