 5
5peptides
spectra
0.000 | 0.000
0.000 | 0.000
0.000 | 0.000
0.000 | 0.062
0.000 | 0.135
0.399 | 0.531
0.266 | 0.327
0.113 | 0.157
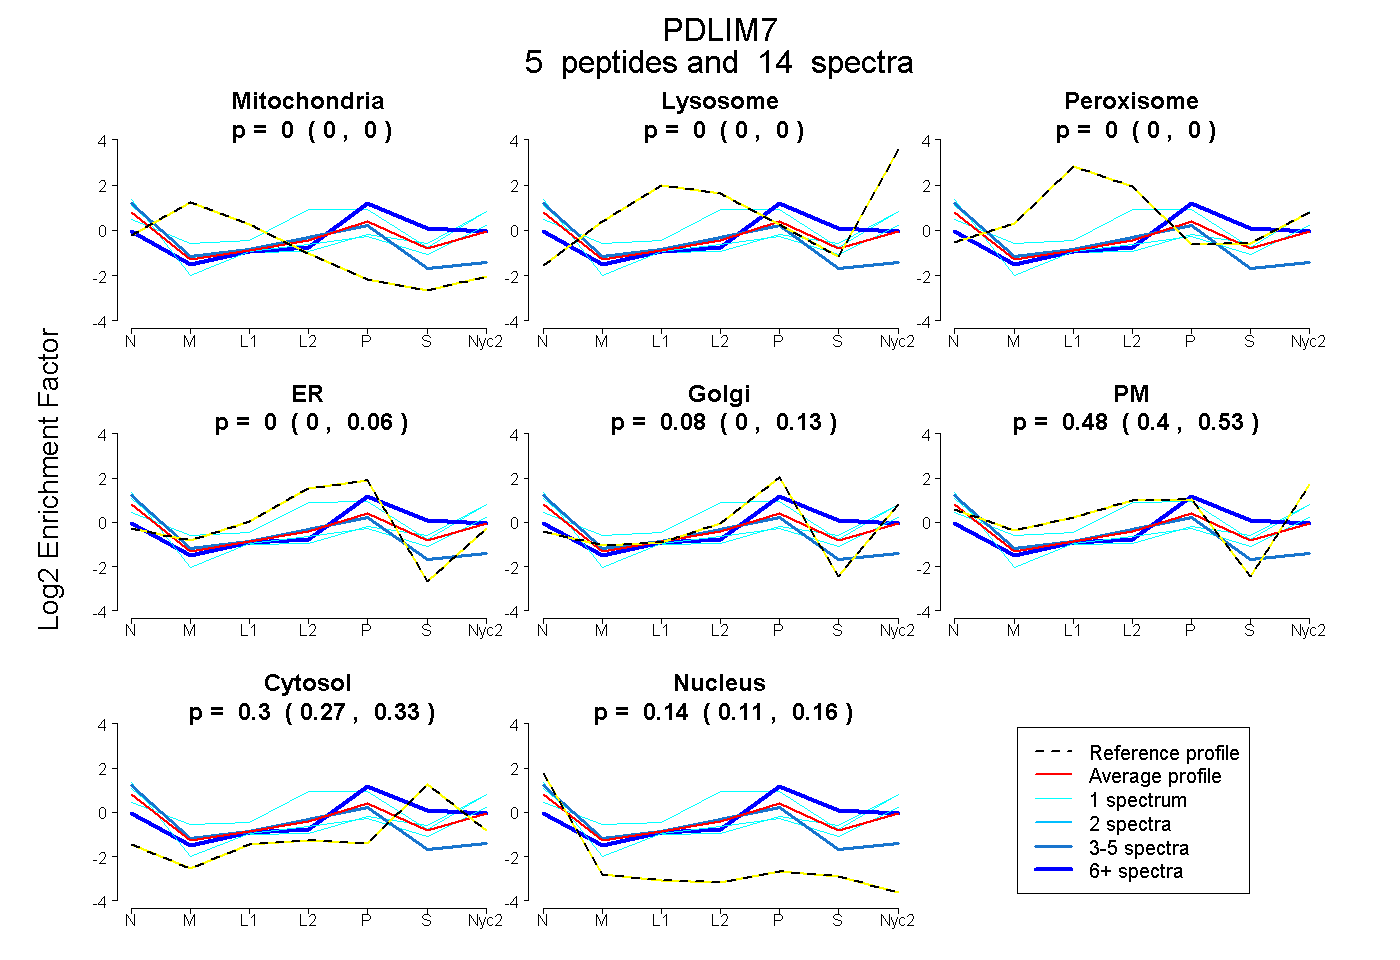
| Plot | Mito | Lyso | Perox | ER | Golgi | PM | Cytosol | Nucleus | |||||
| Expt A |
5 peptides |
14 spectra |
|
0.000 0.000 | 0.000 |
0.000 0.000 | 0.000 |
0.000 0.000 | 0.000 |
0.000 0.000 | 0.062 |
0.082 0.000 | 0.135 |
0.481 0.399 | 0.531 |
0.299 0.266 | 0.327 |
0.137 0.113 | 0.157 |
| 3 spectra, VLEEGGFFEEK | 0.000 | 0.000 | 0.095 | 0.381 | 0.000 | 0.124 | 0.050 | 0.350 | ||
| 1 spectrum, TSTVLTR | 0.000 | 0.000 | 0.000 | 0.000 | 0.000 | 0.518 | 0.252 | 0.231 | ||
| 1 spectrum, DFNVPLSISR | 0.000 | 0.000 | 0.000 | 0.000 | 0.000 | 0.537 | 0.333 | 0.130 | ||
| 8 spectra, SSQVPR | 0.000 | 0.000 | 0.005 | 0.000 | 0.509 | 0.036 | 0.450 | 0.000 | ||
| 1 spectrum, HSQPATPTPLQNR | 0.000 | 0.000 | 0.030 | 0.105 | 0.000 | 0.628 | 0.237 | 0.000 |
| Plot | Mito | Lyso or Perox | ER | Golgi | PM | Cytosol | Nucleus | ||||||
| Expt B |
1 peptide |
1 spectrum |
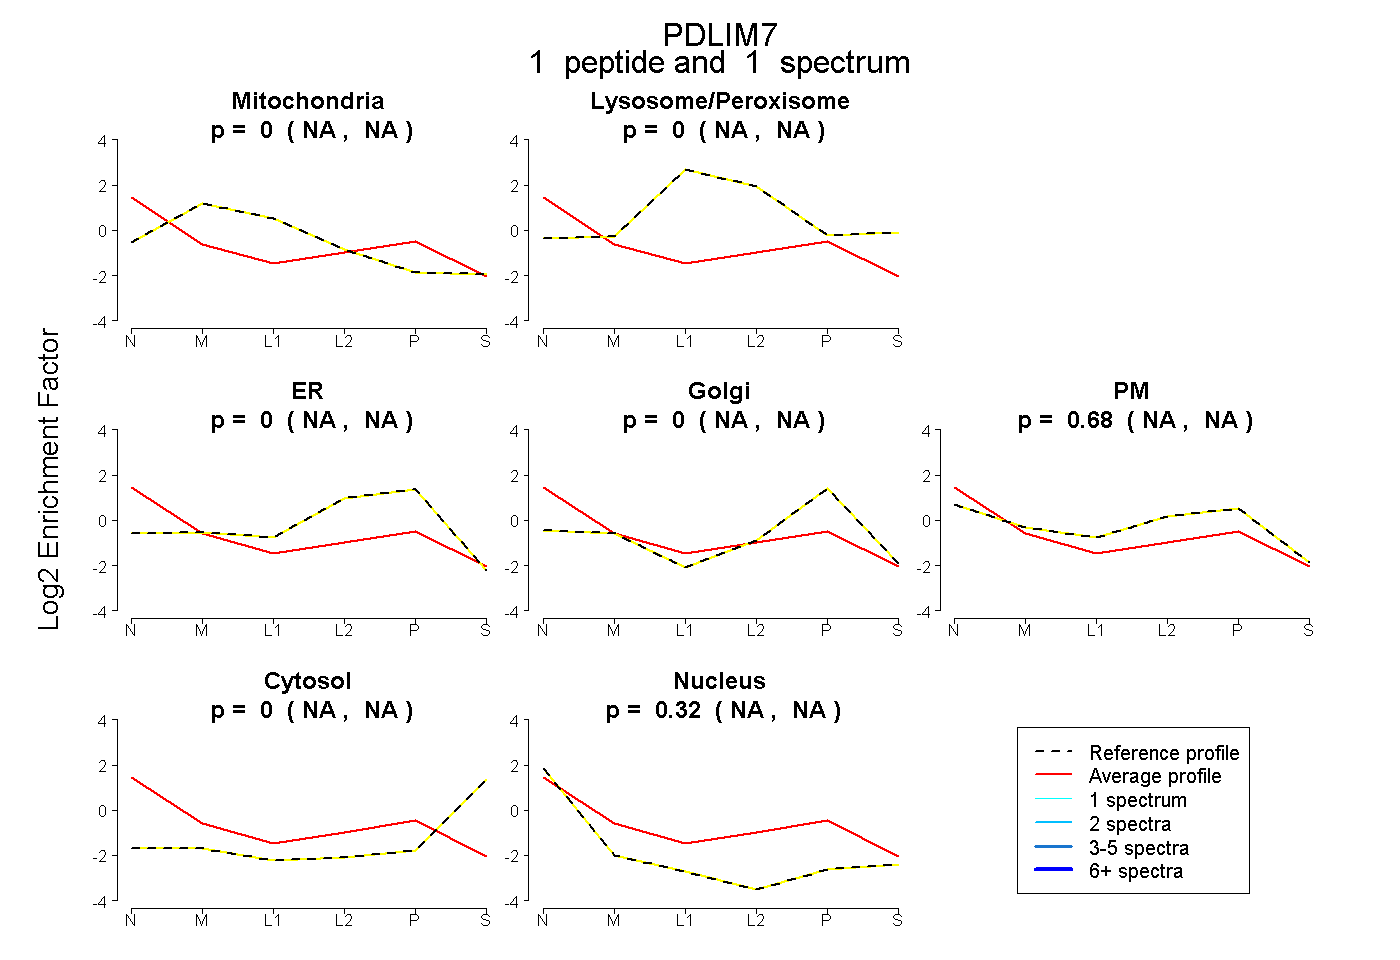 |
0.000 NA | NA |
0.000 NA | NA |
0.000 NA | NA |
0.000 NA | NA |
0.677 NA | NA |
0.000 NA | NA |
0.323 NA | NA |
|||
| Plot | Lyso | Other | |||||||||||
| Expt C |
1 peptide |
1 spectrum |
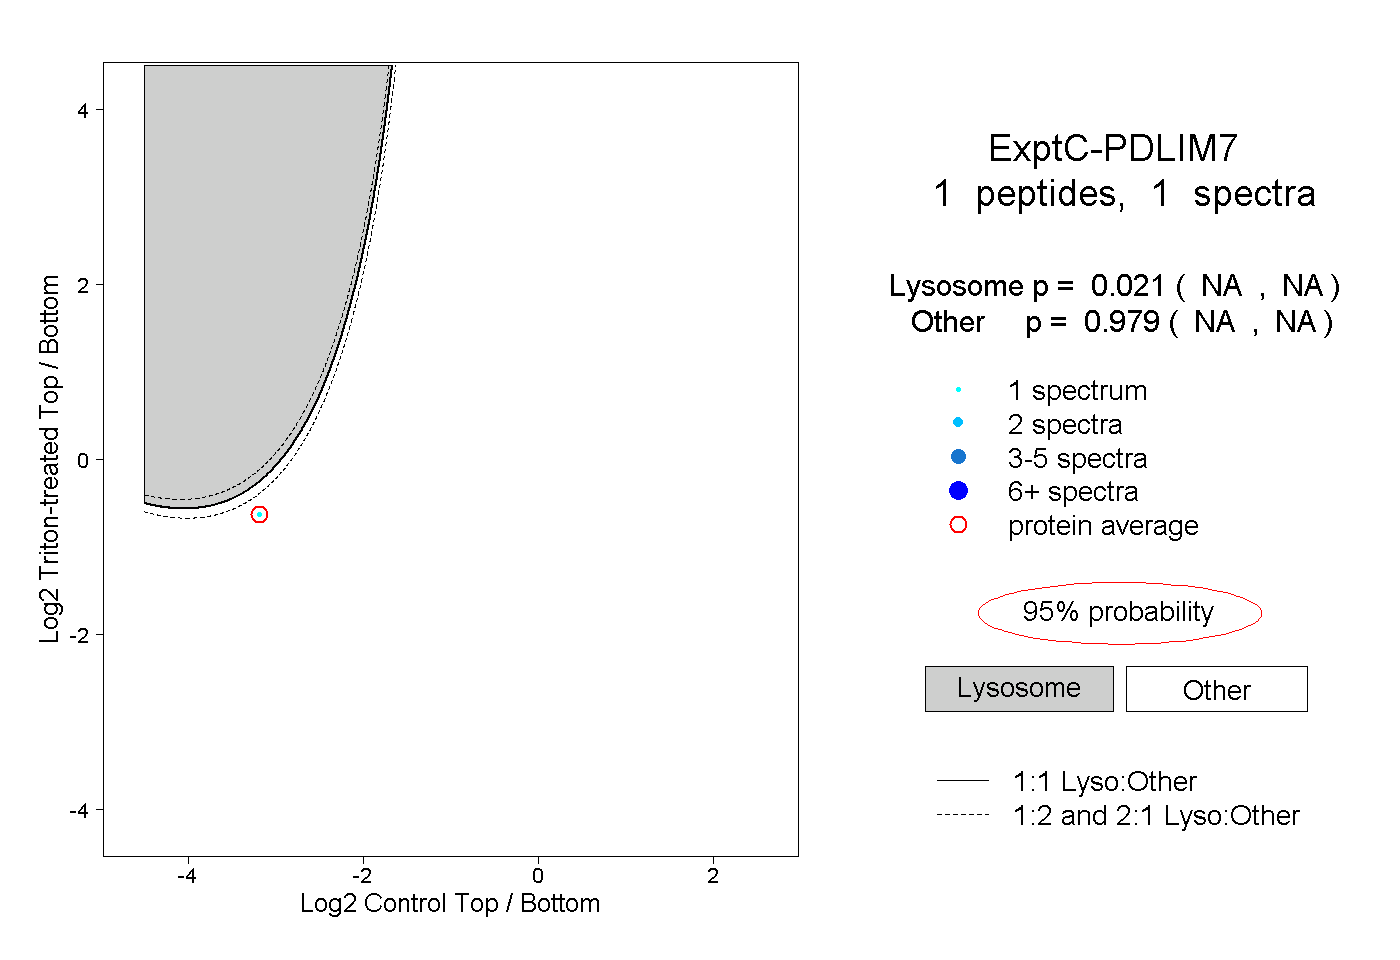 |
0.021 NA | NA |
0.979 NA | NA |