10
10peptides
spectra

0.000 | 0.000
0.385 | 0.400
0.000 | 0.000
0.000 | 0.000
0.000 | 0.000
0.000 | 0.000
0.599 | 0.613
0.000 | 0.000
3peptides
spectra
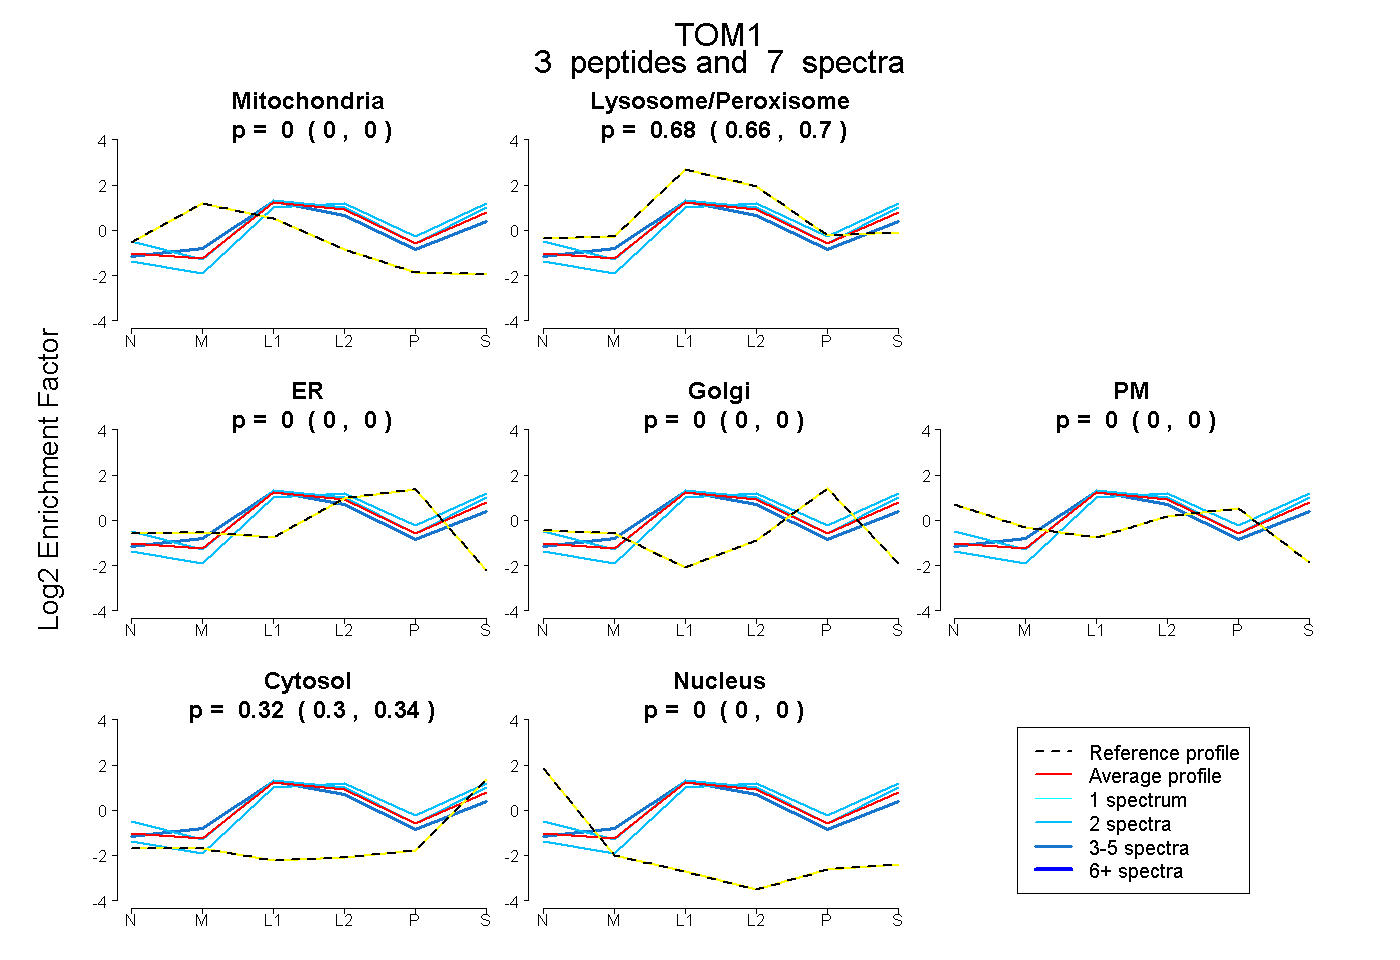
0.000 | 0.000
0.657 | 0.700
0.000 | 0.000
0.000 | 0.000
0.000 | 0.000
0.297 | 0.340
0.000 | 0.000
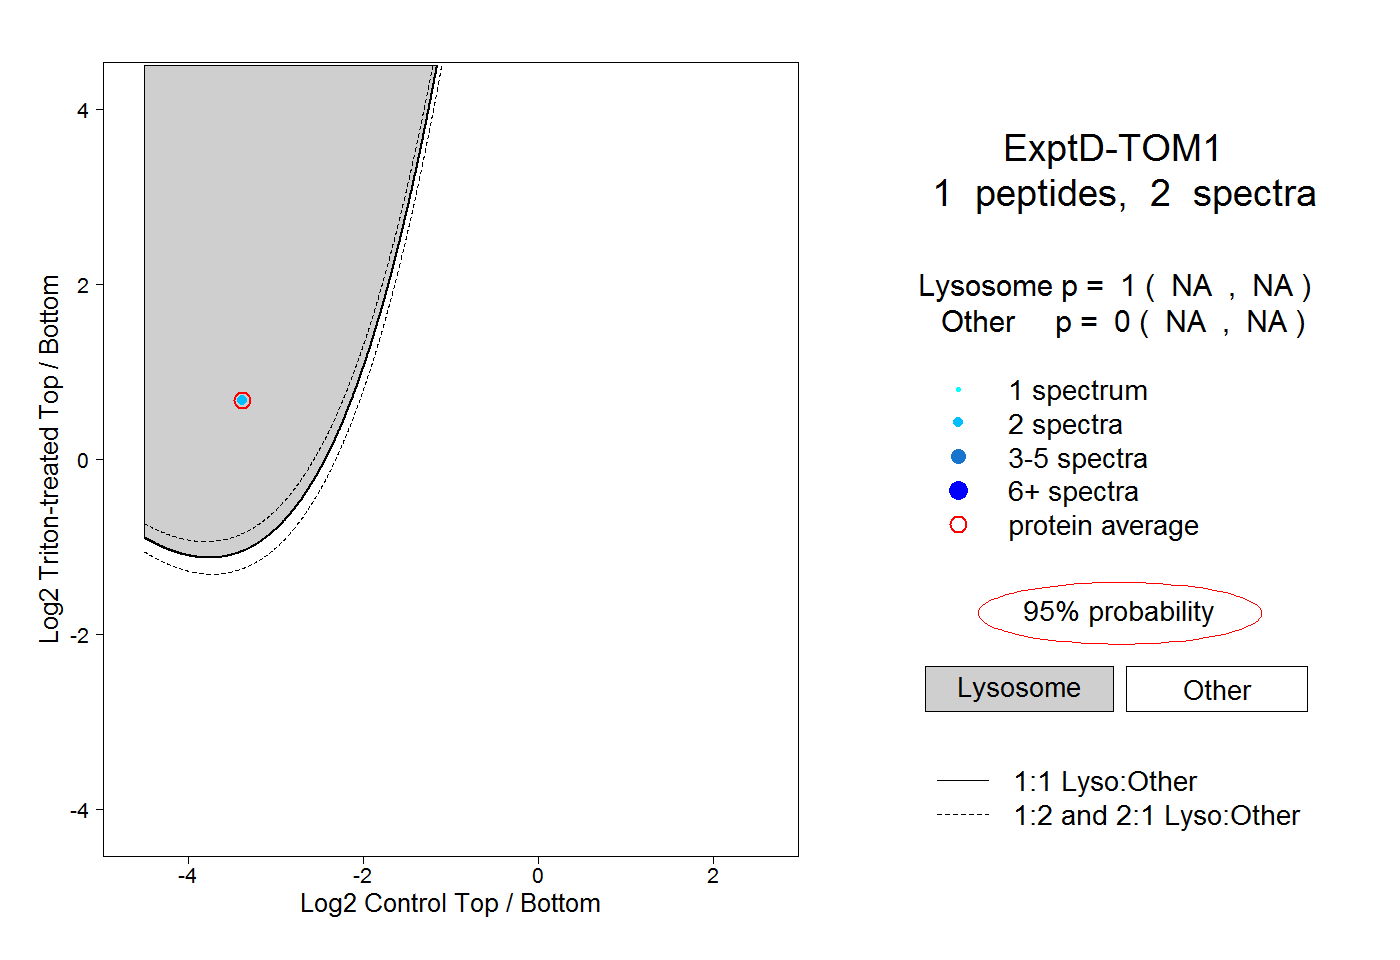
9peptides
spectra
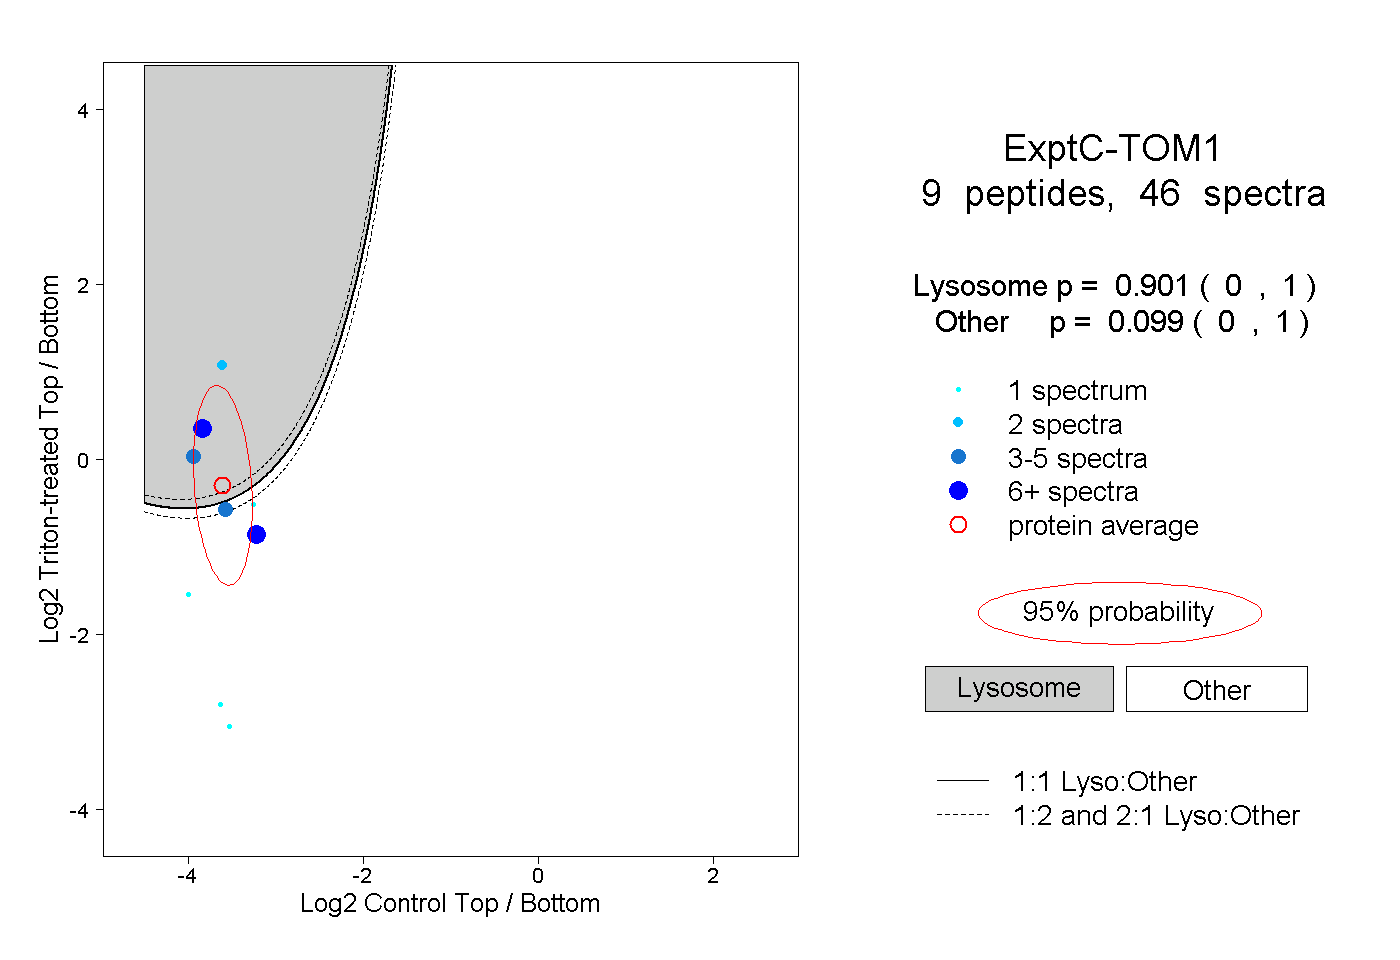
0.000 | 1.000
0.000 | 1.000