 10
10peptides
spectra

0.000 | 0.000
0.385 | 0.400
0.000 | 0.000
0.000 | 0.000
0.000 | 0.000
0.000 | 0.000
0.599 | 0.613
0.000 | 0.000
| Plot | Mito | Lyso | Perox | ER | Golgi | PM | Cytosol | Nucleus | |||||
| Expt A |
10 peptides |
25 spectra |
|
0.000 0.000 | 0.000 |
0.393 0.385 | 0.400 |
0.000 0.000 | 0.000 |
0.000 0.000 | 0.000 |
0.000 0.000 | 0.000 |
0.000 0.000 | 0.000 |
0.607 0.599 | 0.613 |
0.000 0.000 | 0.000 |
| 1 spectrum, TGQTAK | 0.000 | 0.436 | 0.000 | 0.000 | 0.000 | 0.000 | 0.564 | 0.000 | ||
| 1 spectrum, GLEFPMTDLDMLSPIHTPQR | 0.000 | 0.402 | 0.000 | 0.000 | 0.000 | 0.000 | 0.598 | 0.000 | ||
| 3 spectra, NNPPTIVHDK | 0.000 | 0.472 | 0.000 | 0.000 | 0.000 | 0.025 | 0.504 | 0.000 | ||
| 4 spectra, ILELLPR | 0.000 | 0.503 | 0.000 | 0.000 | 0.000 | 0.000 | 0.497 | 0.000 | ||
| 2 spectra, YEAPQTTDGLAGALDAR | 0.000 | 0.254 | 0.000 | 0.000 | 0.000 | 0.000 | 0.746 | 0.000 | ||
| 7 spectra, GSSLADQR | 0.000 | 0.343 | 0.000 | 0.000 | 0.000 | 0.000 | 0.657 | 0.000 | ||
| 2 spectra, TVFNSETPSR | 0.000 | 0.456 | 0.000 | 0.000 | 0.000 | 0.000 | 0.544 | 0.000 | ||
| 3 spectra, LPNLASPSAEGPPRPCPGAAPR | 0.000 | 0.243 | 0.000 | 0.000 | 0.000 | 0.000 | 0.757 | 0.000 | ||
| 1 spectrum, AGLQSLEASGHLEDDFDMFALTR | 0.000 | 0.305 | 0.000 | 0.000 | 0.000 | 0.000 | 0.695 | 0.000 | ||
| 1 spectrum, SELEMVNGNVR | 0.000 | 0.511 | 0.000 | 0.000 | 0.000 | 0.000 | 0.489 | 0.000 |
| Plot | Mito | Lyso or Perox | ER | Golgi | PM | Cytosol | Nucleus | ||||||
| Expt B |
3 peptides |
7 spectra |
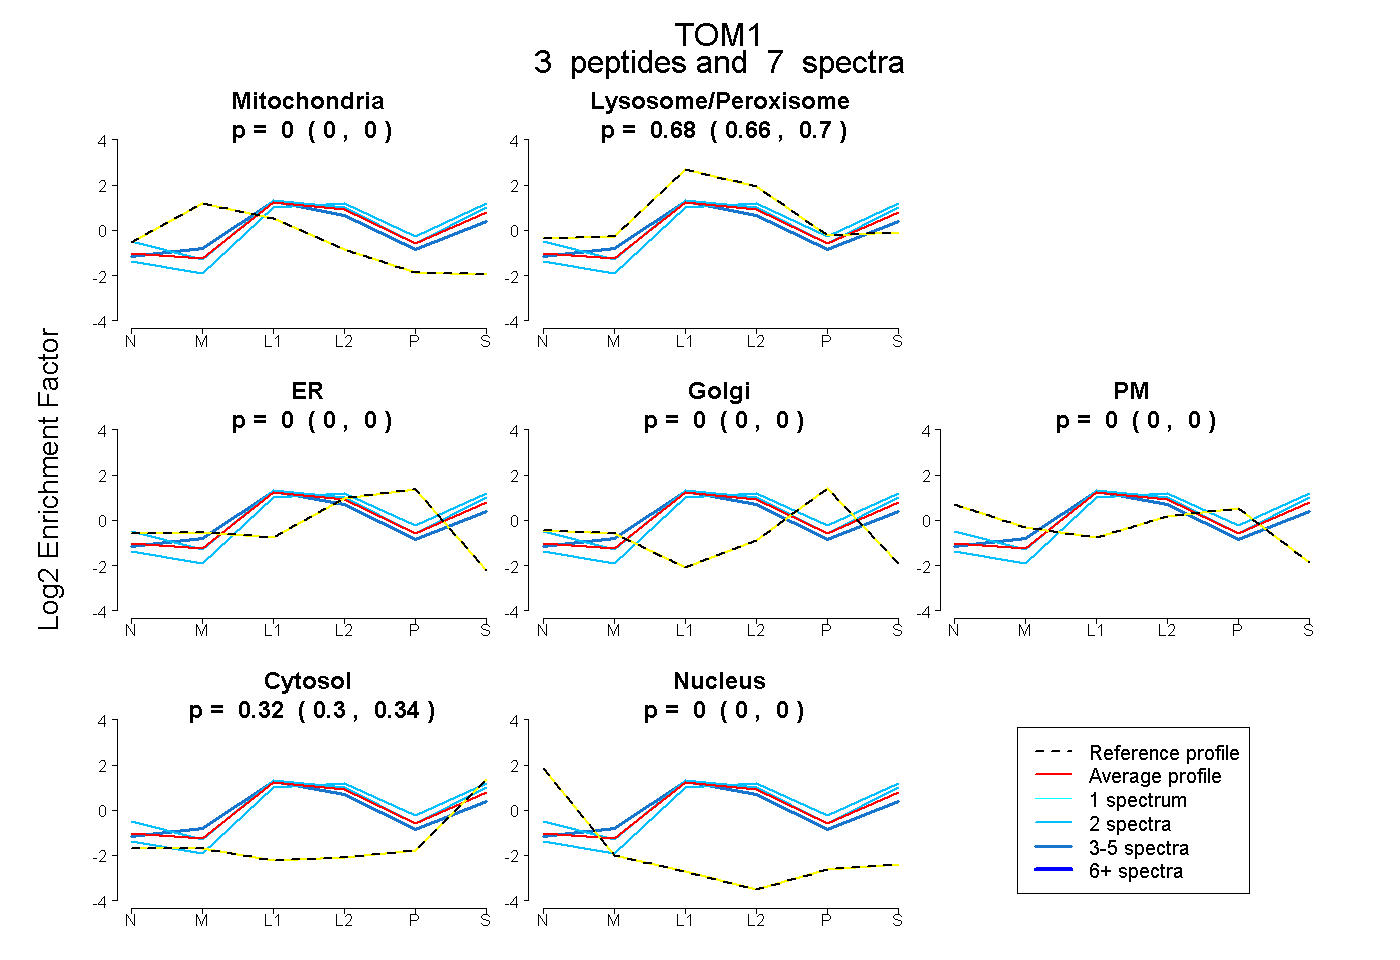 |
0.000 0.000 | 0.000 |
0.679 0.657 | 0.700 |
0.000 0.000 | 0.000 |
0.000 0.000 | 0.000 |
0.000 0.000 | 0.000 |
0.321 0.297 | 0.340 |
0.000 0.000 | 0.000 |
|||
| Plot | Lyso | Other | |||||||||||
| Expt C |
9 peptides |
46 spectra |
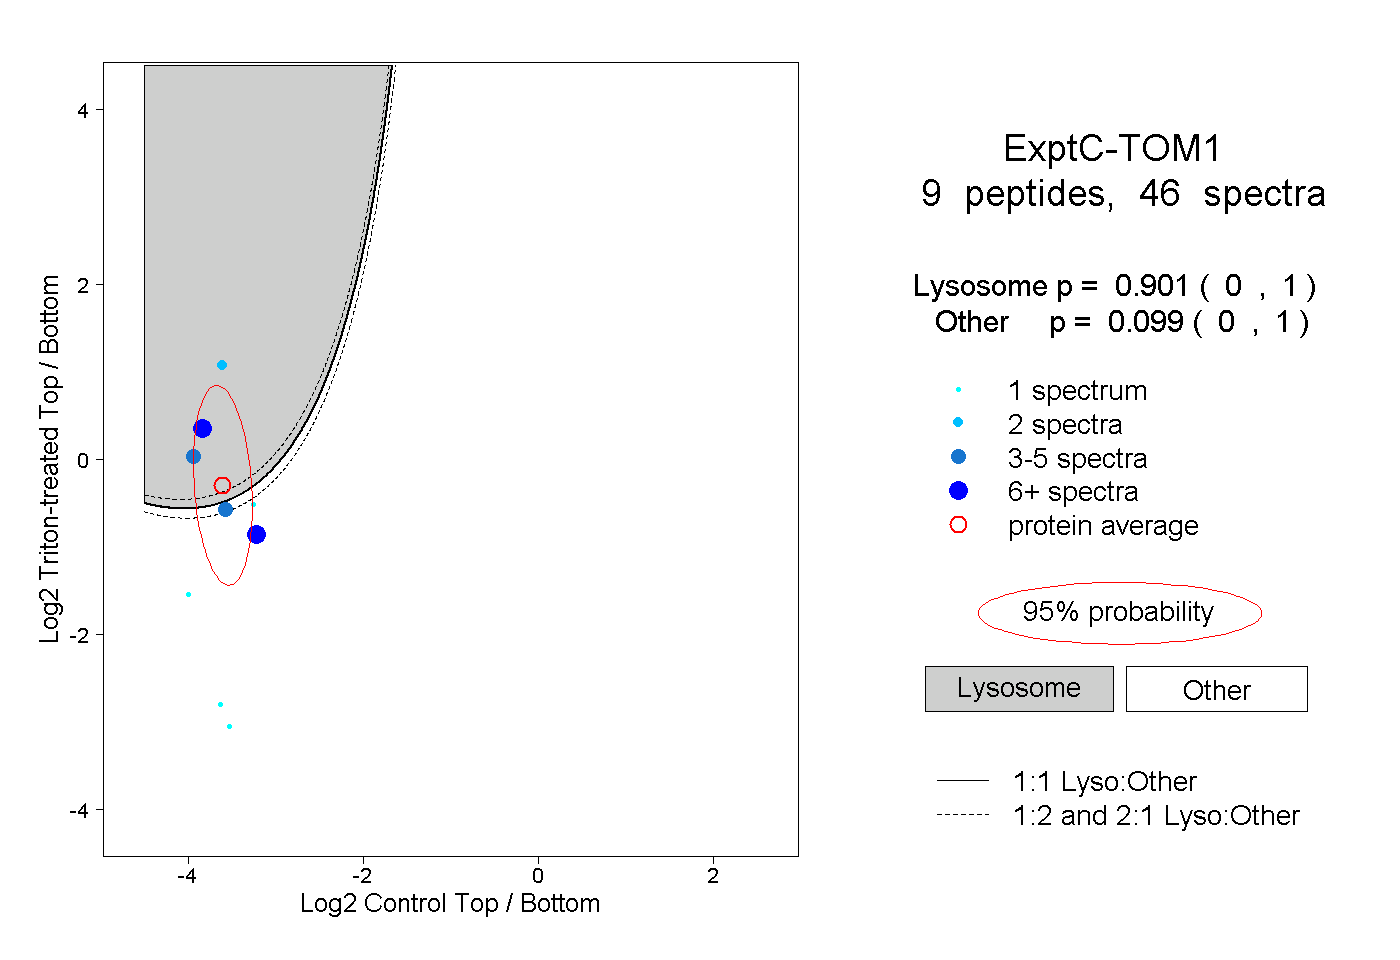 |
0.901 0.000 | 1.000 |
0.099 0.000 | 1.000 |
||||||||
| Plot | Lyso | Other | |||||||||||
| Expt D |
1 peptide |
2 spectra |
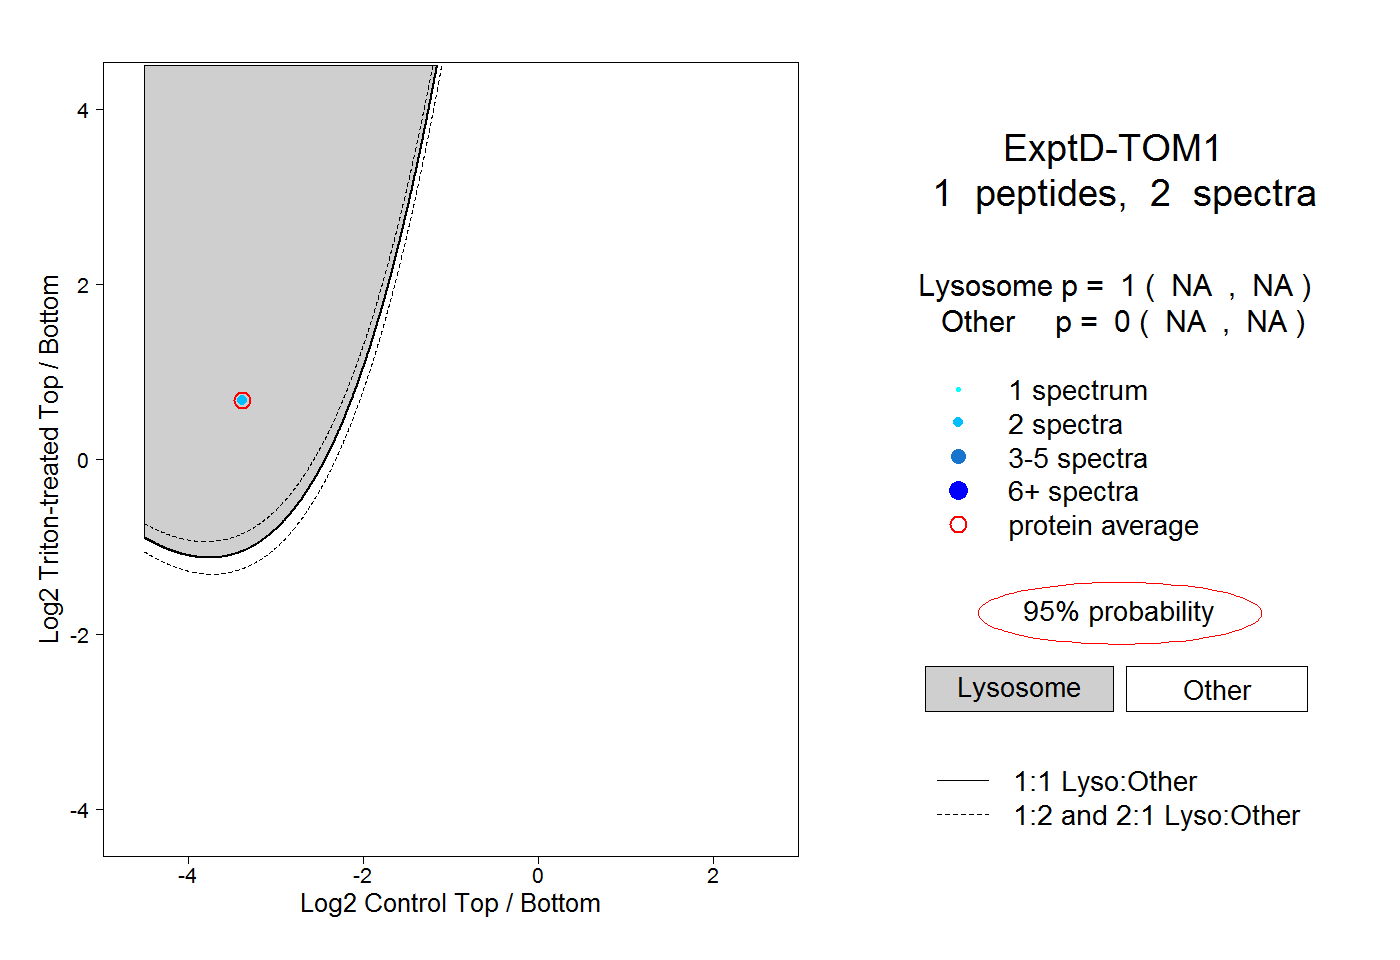 |
1.000 NA | NA |
0.000 NA | NA |