 12
12peptides
spectra
0.000 | 0.000
0.307 | 0.337
0.000 | 0.000
0.000 | 0.000
0.000 | 0.024
0.580 | 0.621
0.055 | 0.074
0.000 | 0.000
| Plot | Mito | Lyso | Perox | ER | Golgi | PM | Cytosol | Nucleus | |||||
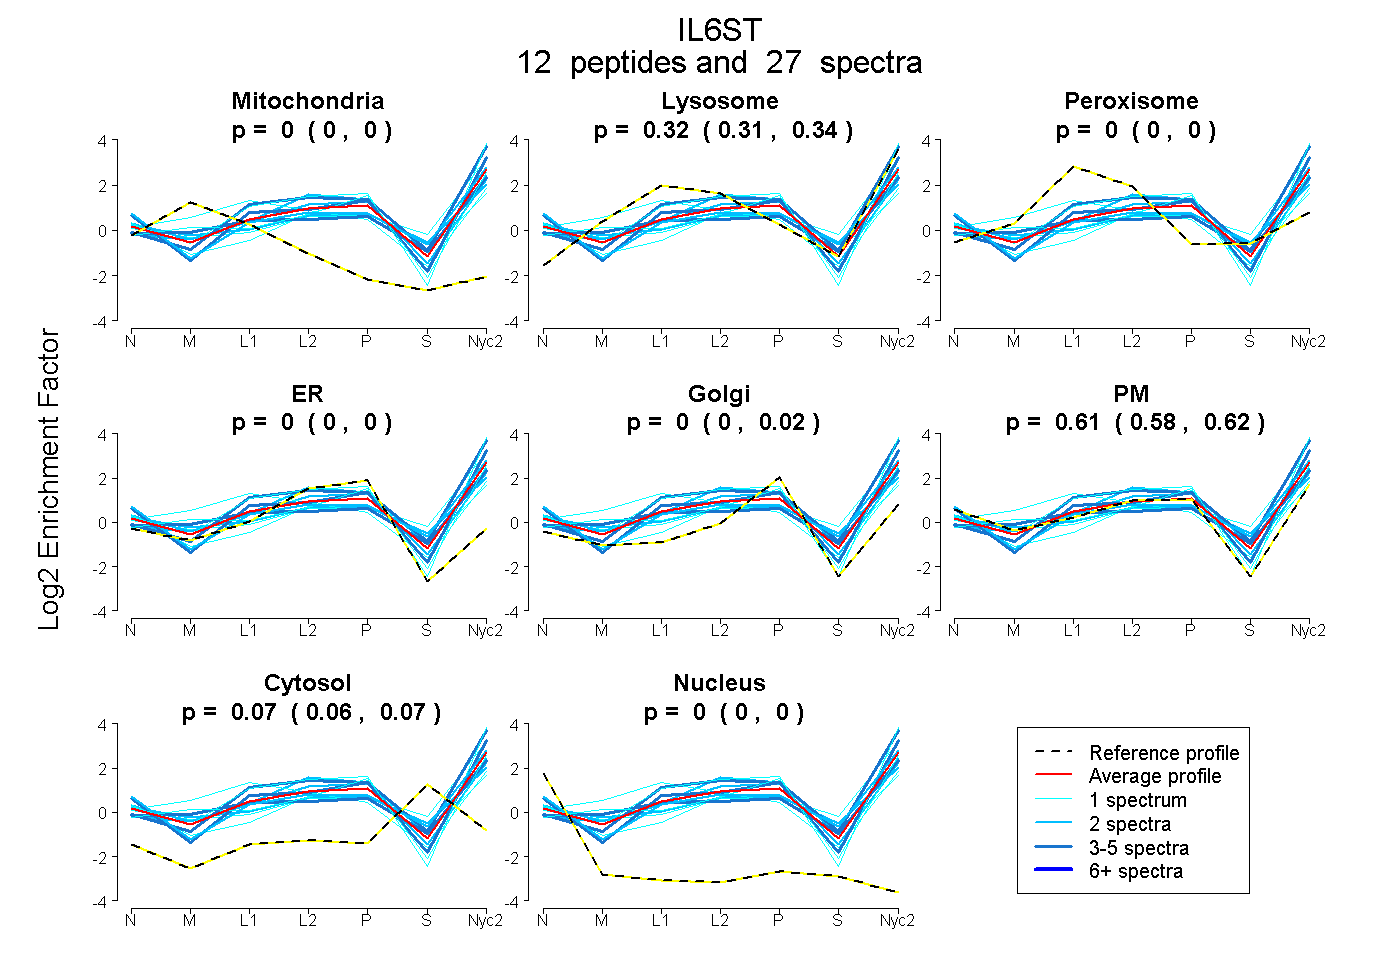
| Expt A |
12 peptides |
27 spectra |
|
0.000 0.000 | 0.000 |
0.323 0.307 | 0.337 |
0.000 0.000 | 0.000 |
0.000 0.000 | 0.000 |
0.003 0.000 | 0.024 |
0.607 0.580 | 0.621 |
0.066 0.055 | 0.074 |
0.000 0.000 | 0.000 |
| 1 spectrum, TNHVAVPK | 0.000 | 0.308 | 0.000 | 0.000 | 0.304 | 0.388 | 0.000 | 0.000 | ||
| 5 spectra, SYLPQTVR | 0.000 | 0.246 | 0.000 | 0.000 | 0.000 | 0.754 | 0.000 | 0.000 | ||
| 5 spectra, SSQVPSGSEEDFVR | 0.000 | 0.367 | 0.000 | 0.000 | 0.000 | 0.479 | 0.154 | 0.000 | ||
| 2 spectra, HIWPNVPDPSK | 0.000 | 0.400 | 0.000 | 0.031 | 0.110 | 0.419 | 0.040 | 0.000 | ||
| 1 spectrum, QSCSQPGASPDVSHFER | 0.078 | 0.264 | 0.187 | 0.000 | 0.000 | 0.472 | 0.000 | 0.000 | ||
| 2 spectra, VNANHPQEYR | 0.000 | 0.260 | 0.000 | 0.000 | 0.000 | 0.591 | 0.149 | 0.000 | ||
| 2 spectra, HQVPSVQVFSR | 0.000 | 0.223 | 0.000 | 0.000 | 0.037 | 0.711 | 0.029 | 0.000 | ||
| 2 spectra, QGGYMPQ | 0.000 | 0.258 | 0.000 | 0.000 | 0.000 | 0.544 | 0.198 | 0.000 | ||
| 1 spectrum, TSFTVQDLKPFTEYVFR | 0.000 | 0.409 | 0.000 | 0.000 | 0.000 | 0.591 | 0.000 | 0.000 | ||
| 1 spectrum, FESVGMETAMDEDISK | 0.000 | 0.438 | 0.000 | 0.000 | 0.000 | 0.384 | 0.178 | 0.000 | ||
| 4 spectra, SPATVLTIPGSHFK | 0.000 | 0.599 | 0.000 | 0.000 | 0.021 | 0.380 | 0.000 | 0.000 | ||
| 1 spectrum, SEWATEK | 0.000 | 0.061 | 0.000 | 0.000 | 0.201 | 0.576 | 0.161 | 0.000 |
| Plot | Lyso | Other | |||||||||||
| Expt C |
14 peptides |
56 spectra |
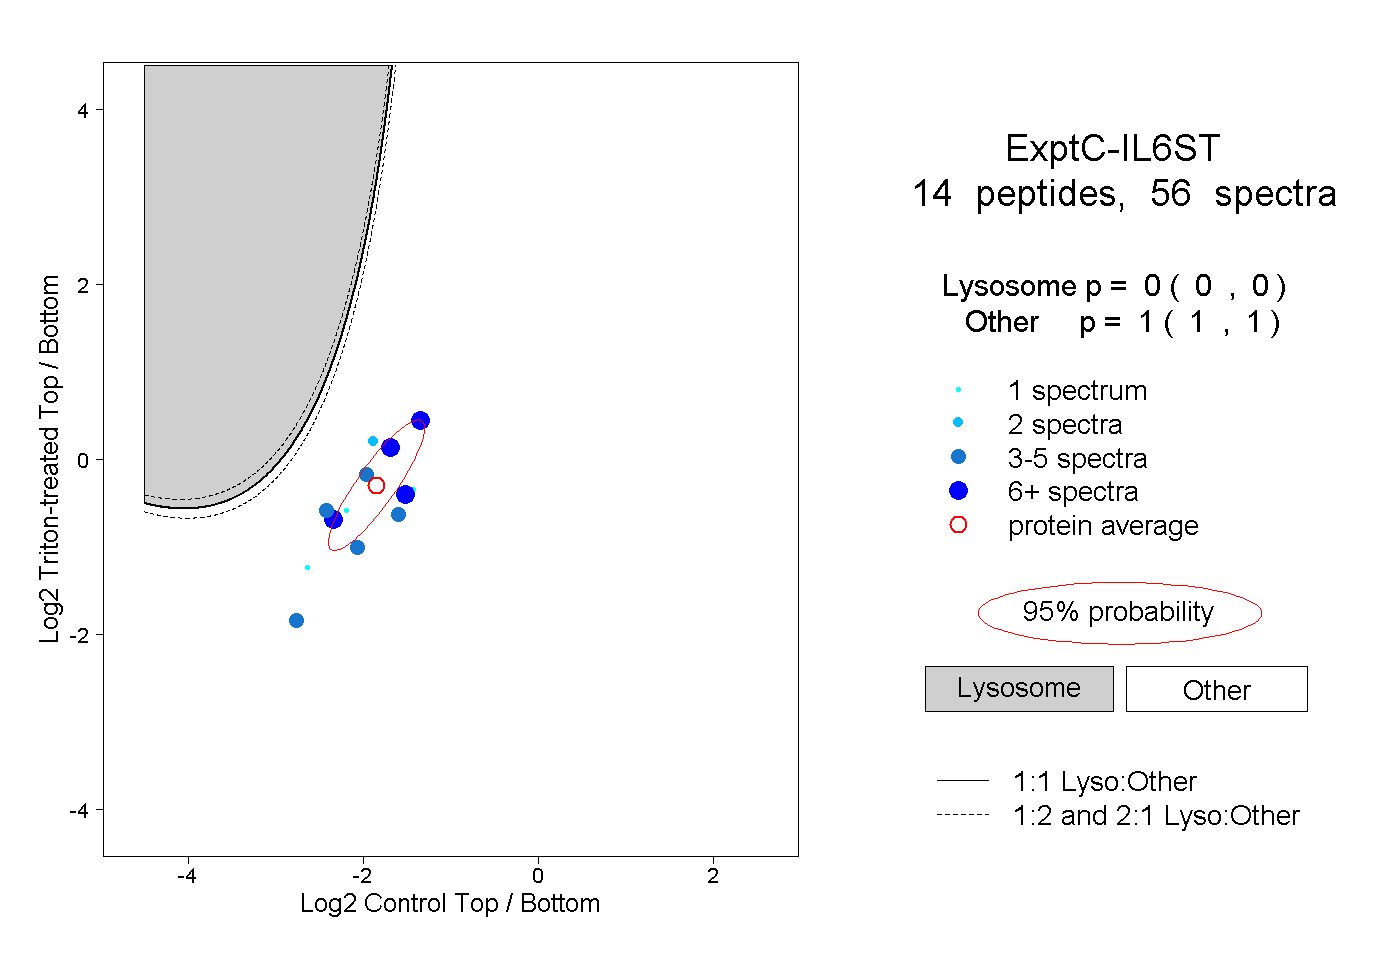 |
0.000 0.000 | 0.000 |
1.000 1.000 | 1.000 |
||||||||
| Plot | Lyso | Other | |||||||||||
| Expt D |
2 peptides |
3 spectra |
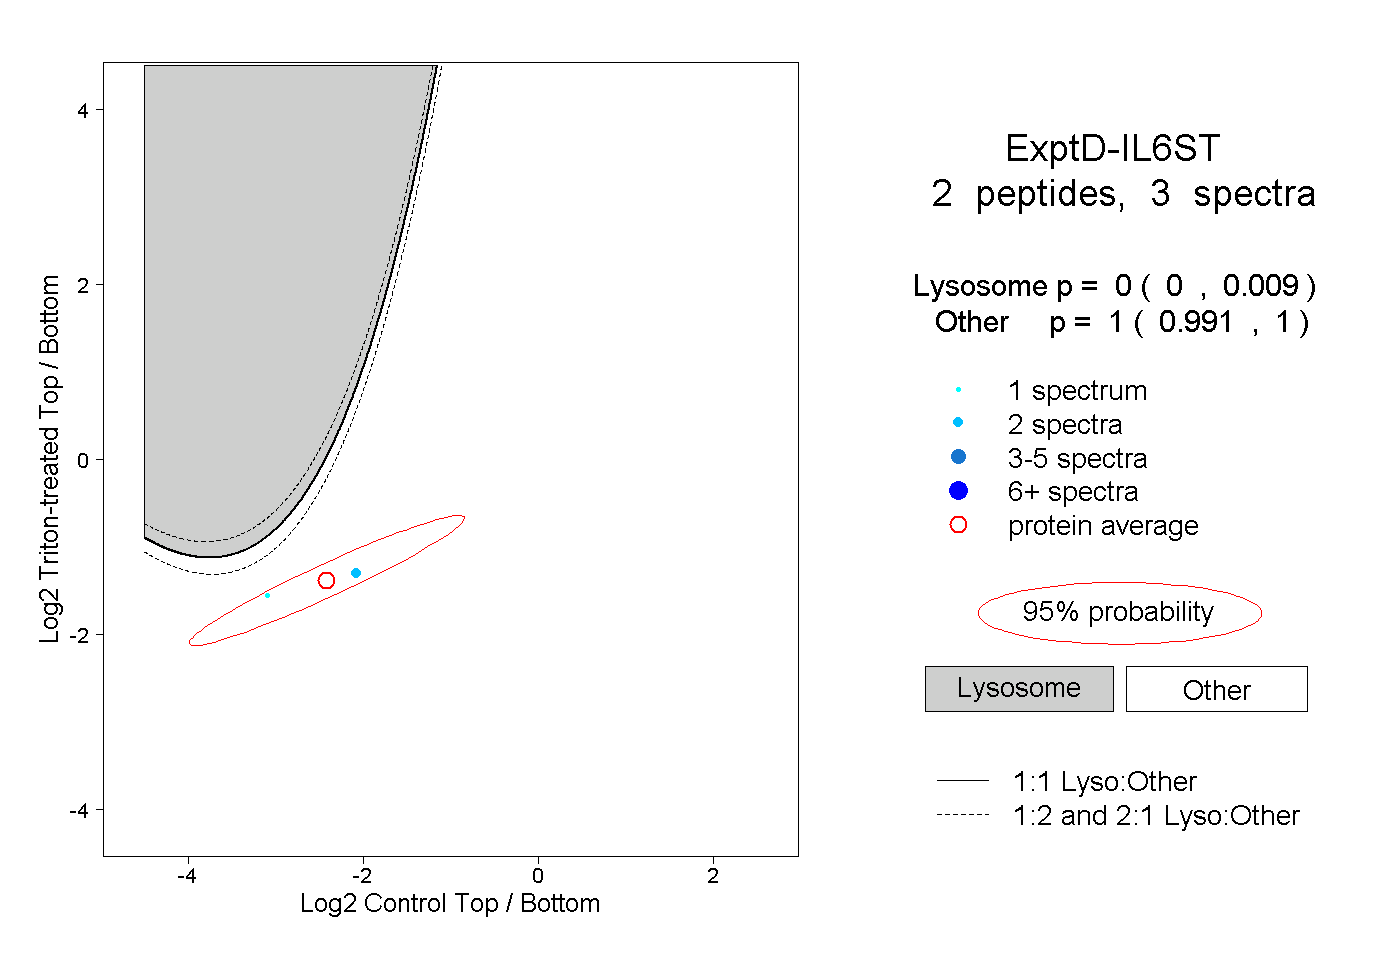 |
0.000 0.000 | 0.009 |
1.000 0.991 | 1.000 |