SIRT3
[ENSRNOP00000018861]
Main page
| | | Plot |
Mito |
Lyso |
|
Perox |
ER |
Golgi |
PM |
Cytosol |
Nucleus |
|
| Expt A |
 4
4
peptides |
9
spectra |
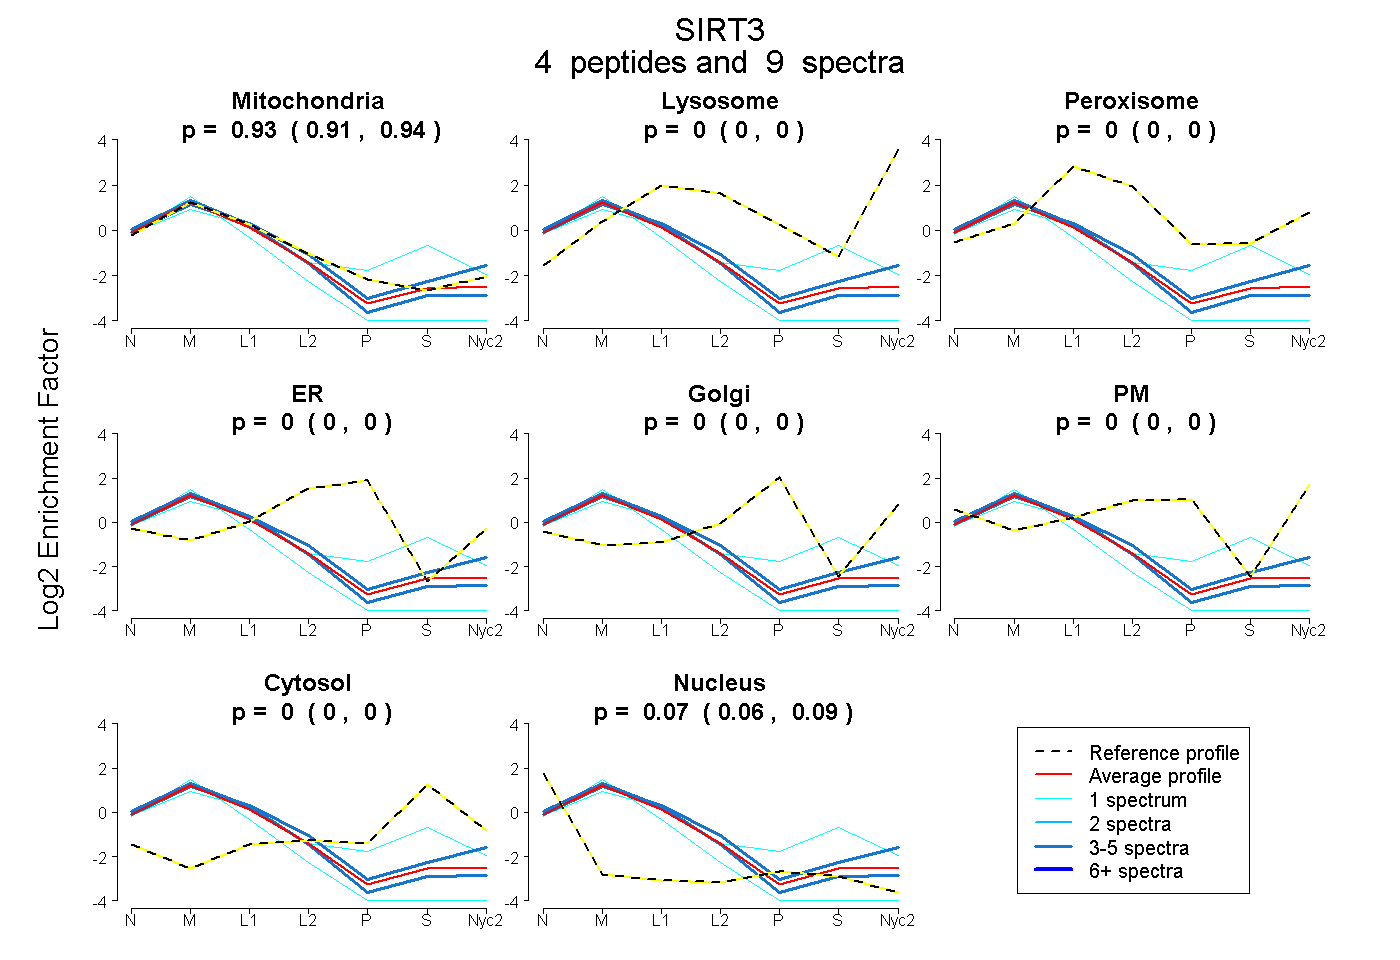 |
0.926
0.907 | 0.941 |
0.000
0.000 | 0.000 |
|
0.000
0.000 | 0.000 |
0.000
0.000 | 0.000 |
0.000
0.000 | 0.000 |
0.000
0.000 | 0.000 |
0.000
0.000 | 0.000 |
0.074
0.055 | 0.089 |
|
| | | Plot |
Mito |
|
Lyso or Perox |
|
ER |
Golgi |
PM |
Cytosol |
Nucleus |
|
| Expt B |
2
peptides |
3
spectra |
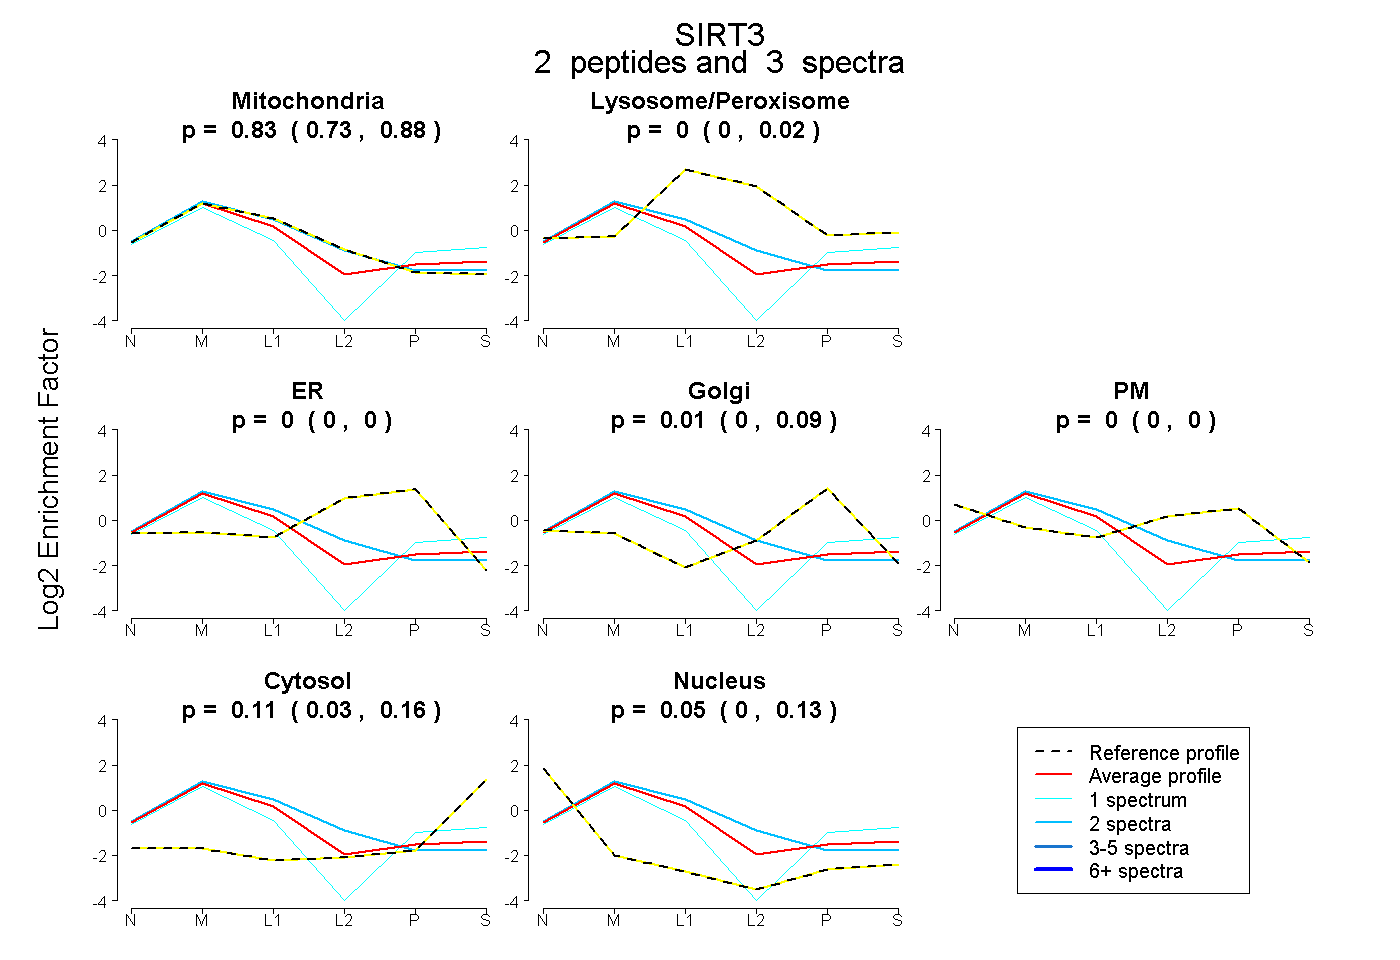 |
0.832
0.729 | 0.885 |
|
0.000
0.000 | 0.019 |
|
0.000
0.000 | 0.000 |
0.011
0.000 | 0.088 |
0.000
0.000 | 0.000 |
0.111
0.029 | 0.156 |
0.046
0.000 | 0.132 |
|
| 1 spectrum, DLVGSFALSPR |
0.540 |
|
0.000 |
|
0.000 |
0.019 |
0.000 |
0.269 |
0.173 |
|
| 2 spectra, SFPGEDIR |
0.968 |
|
0.006 |
|
0.000 |
0.001 |
0.000 |
0.025 |
0.000 |
|
| | | Plot |
|
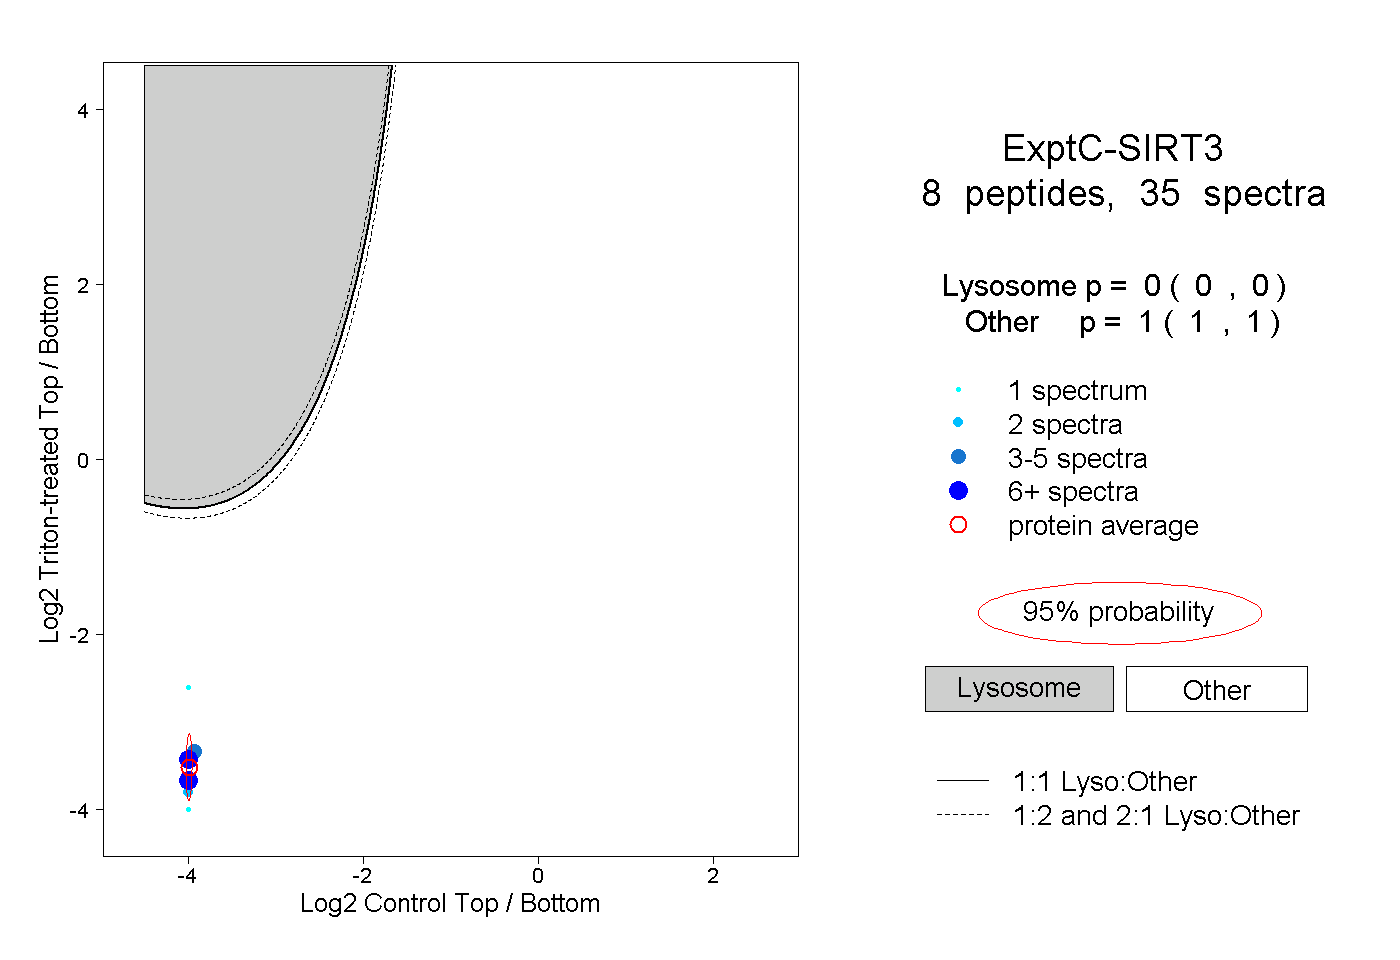
Lyso |
|
|
|
|
|
|
|
Other |
| Expt C |
8
peptides |
35
spectra |
 |
|
0.000
0.000 | 0.000 |
|
|
|
|
|
|
|
1.000
1.000 | 1.000 |