 4
4peptides
spectra
0.907 | 0.941
0.000 | 0.000
0.000 | 0.000
0.000 | 0.000
0.000 | 0.000
0.000 | 0.000
0.000 | 0.000
0.055 | 0.089
| Plot | Mito | Lyso | Perox | ER | Golgi | PM | Cytosol | Nucleus | |||||
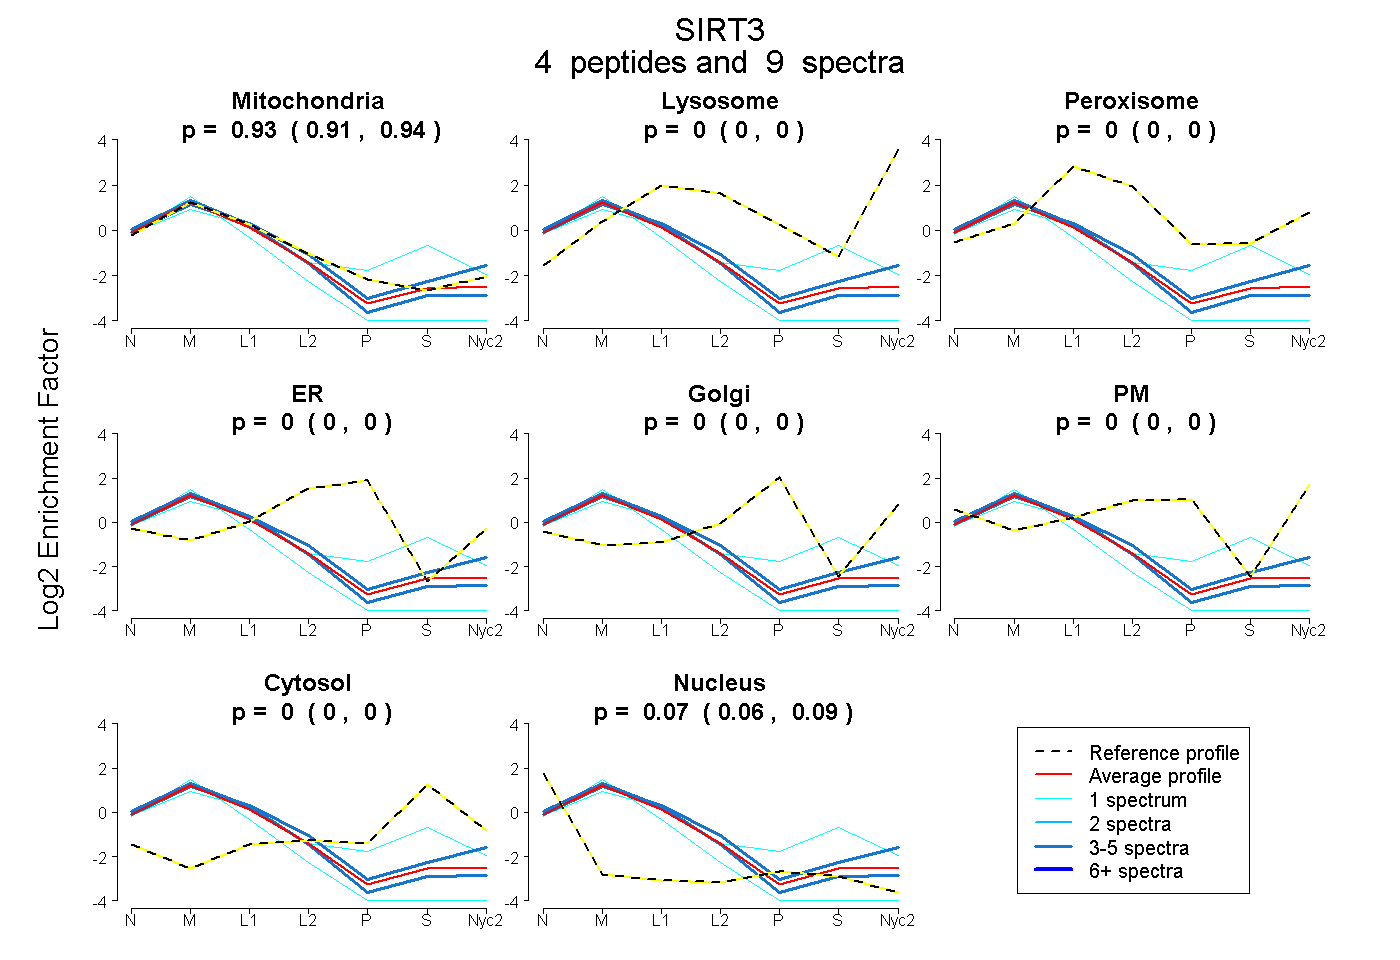
| Expt A |
4 peptides |
9 spectra |
|
0.926 0.907 | 0.941 |
0.000 0.000 | 0.000 |
0.000 0.000 | 0.000 |
0.000 0.000 | 0.000 |
0.000 0.000 | 0.000 |
0.000 0.000 | 0.000 |
0.000 0.000 | 0.000 |
0.074 0.055 | 0.089 |
| 3 spectra, DVVQLGDVVQGVER | 0.947 | 0.000 | 0.011 | 0.000 | 0.000 | 0.000 | 0.042 | 0.000 | ||
| 1 spectrum, ASGIPASK | 0.710 | 0.000 | 0.039 | 0.000 | 0.000 | 0.000 | 0.252 | 0.000 | ||
| 4 spectra, DLVGSFALSPR | 0.914 | 0.000 | 0.000 | 0.000 | 0.000 | 0.000 | 0.000 | 0.086 | ||
| 1 spectrum, CPVCTGVVKPDIVFFGEQLPAR | 0.793 | 0.000 | 0.000 | 0.000 | 0.000 | 0.000 | 0.000 | 0.207 |
| Plot | Mito | Lyso or Perox | ER | Golgi | PM | Cytosol | Nucleus | ||||||
| Expt B |
2 peptides |
3 spectra |
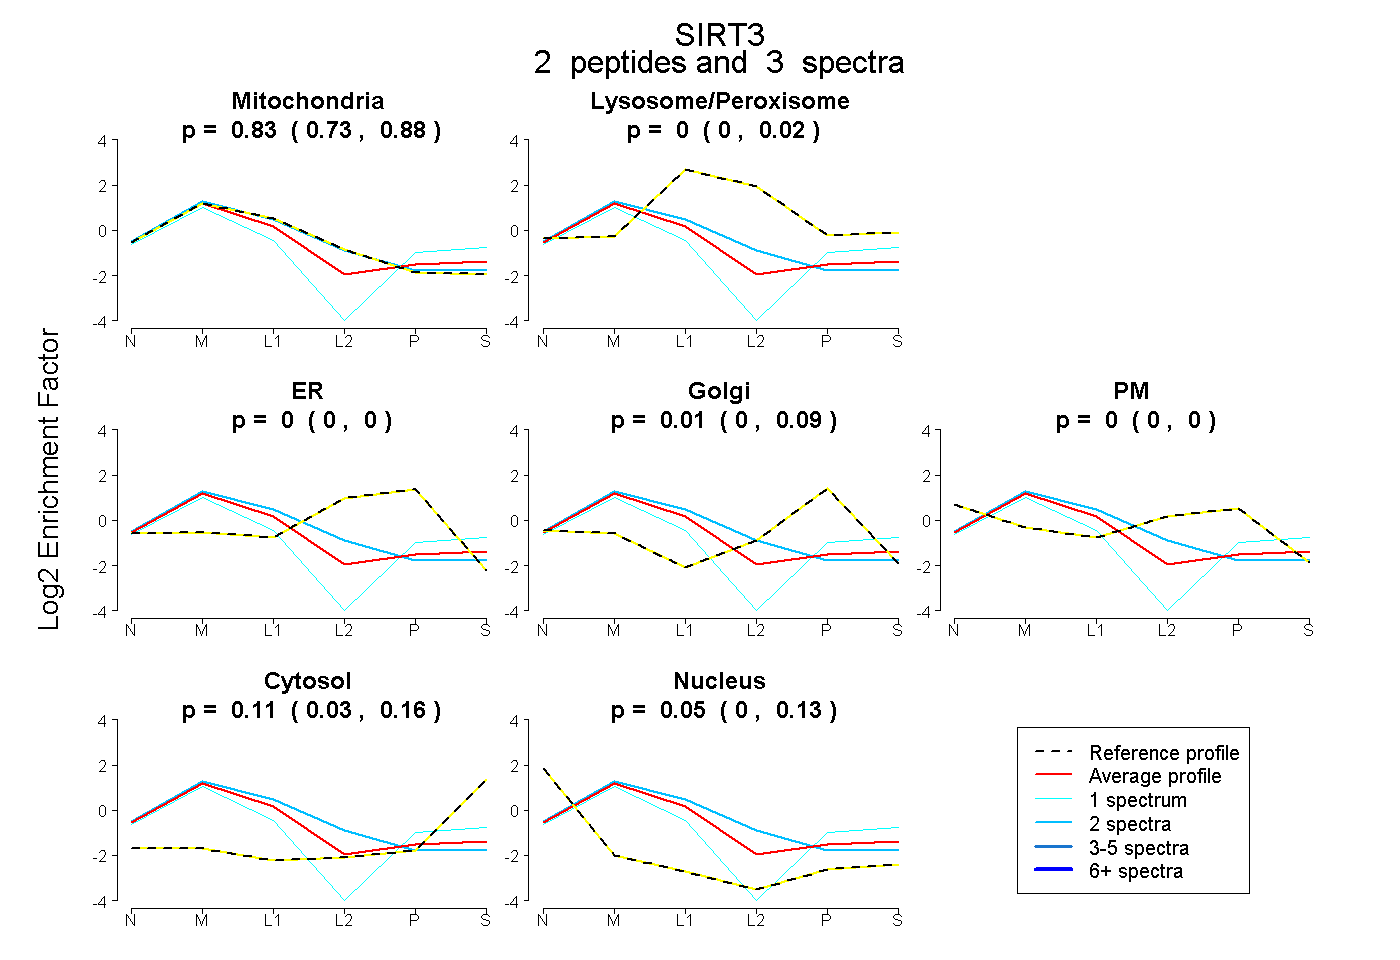 |
0.832 0.729 | 0.885 |
0.000 0.000 | 0.019 |
0.000 0.000 | 0.000 |
0.011 0.000 | 0.088 |
0.000 0.000 | 0.000 |
0.111 0.029 | 0.156 |
0.046 0.000 | 0.132 |
|||
| Plot | Lyso | Other | |||||||||||
| Expt C |
8 peptides |
35 spectra |
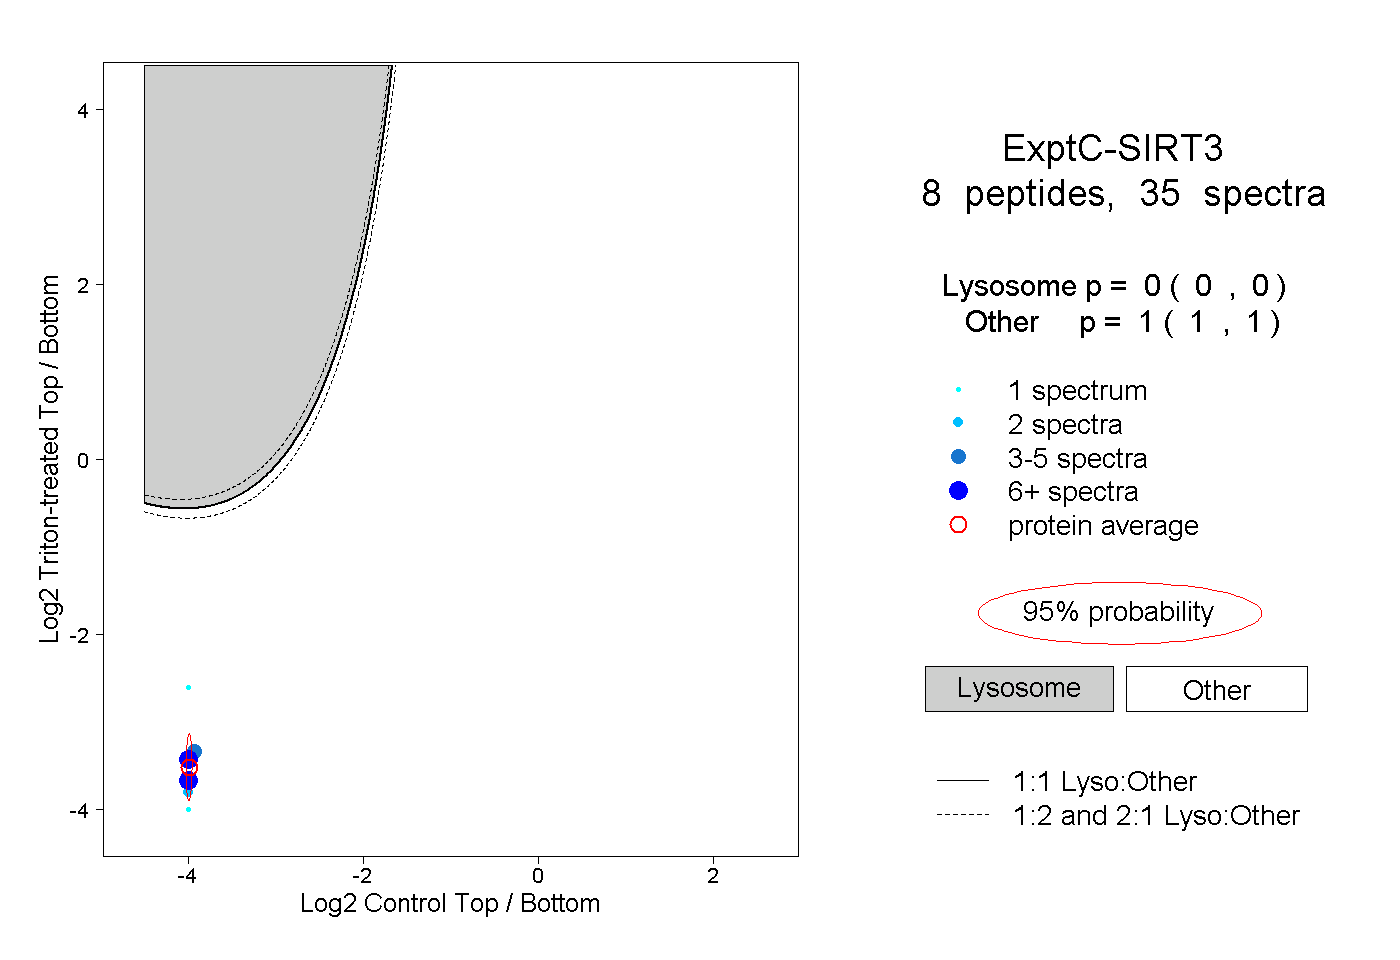 |
0.000 0.000 | 0.000 |
1.000 1.000 | 1.000 |