 17
17peptides
spectra
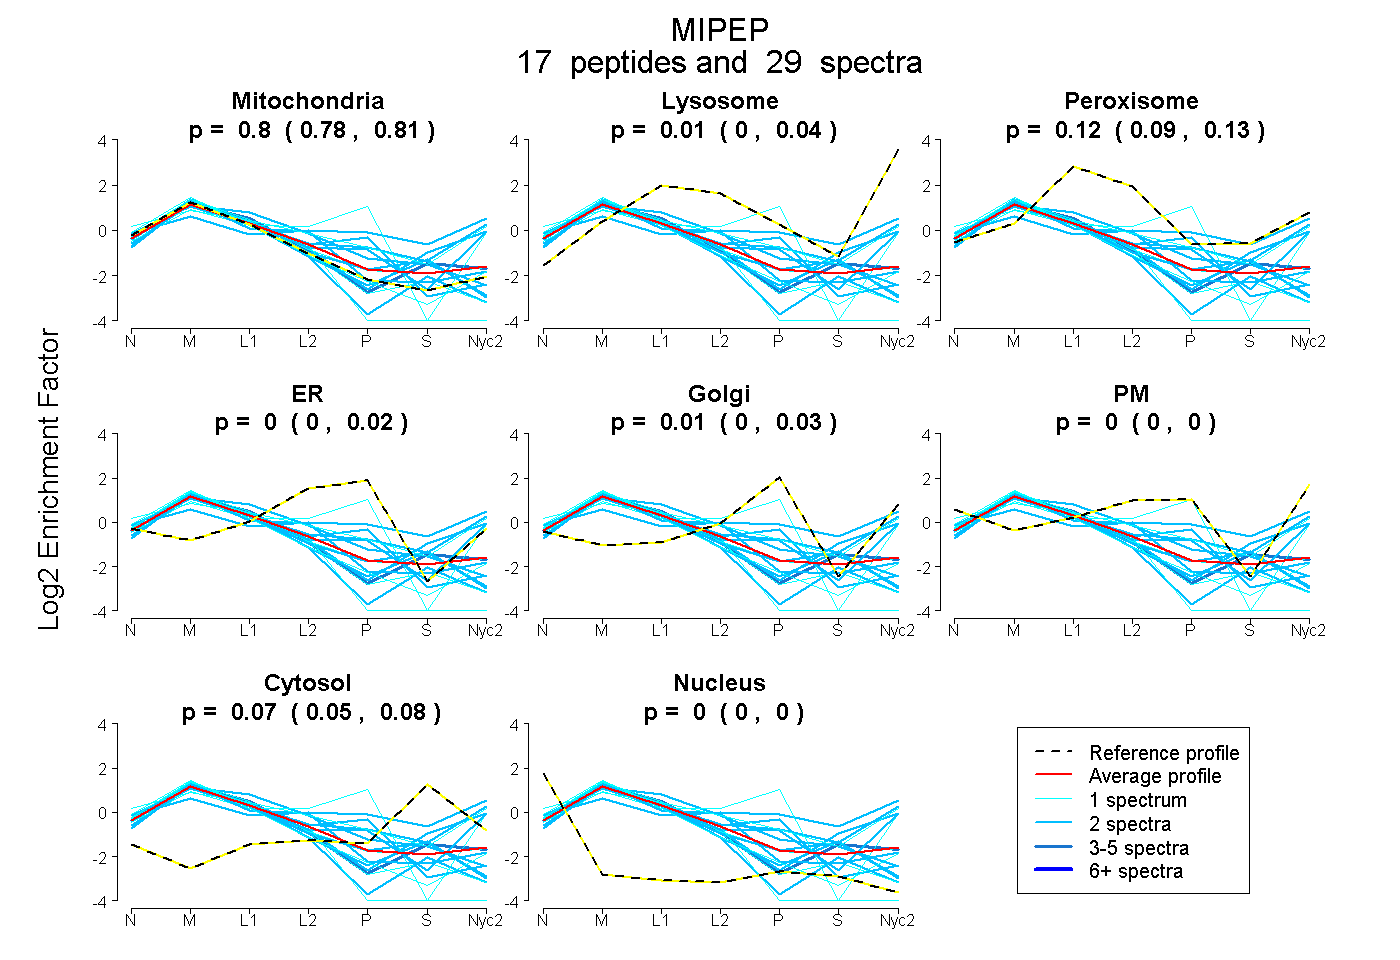
0.779 | 0.809
0.000 | 0.041
0.087 | 0.127
0.000 | 0.017
0.000 | 0.026
0.000 | 0.000
0.054 | 0.076
0.000 | 0.000
6peptides
spectra
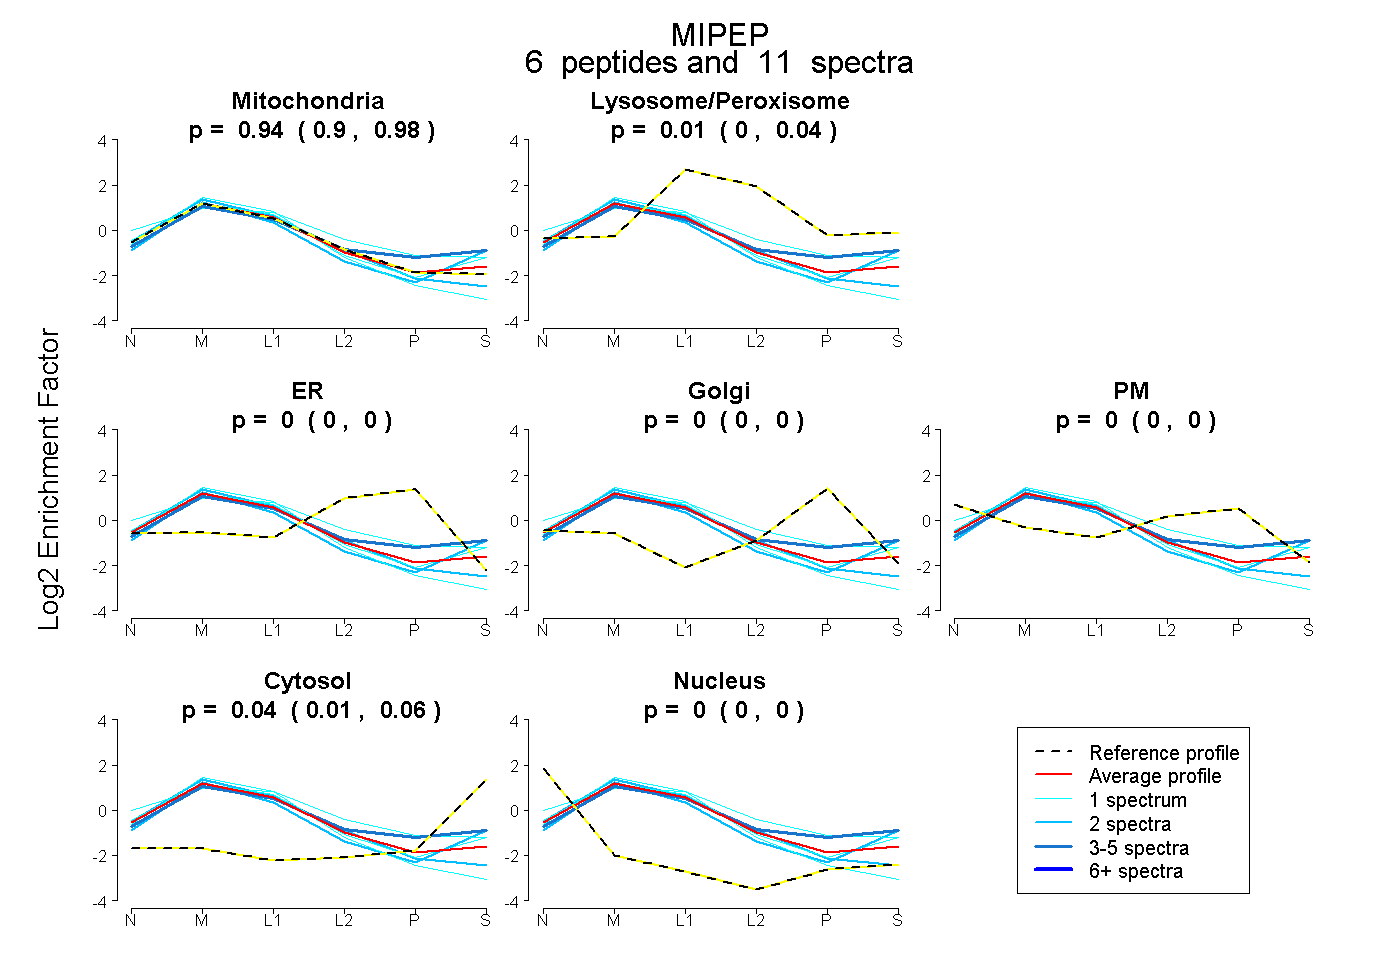
0.900 | 0.977
0.000 | 0.035
0.000 | 0.000
0.000 | 0.000
0.000 | 0.000
0.015 | 0.062
0.000 | 0.000
22peptides
spectra
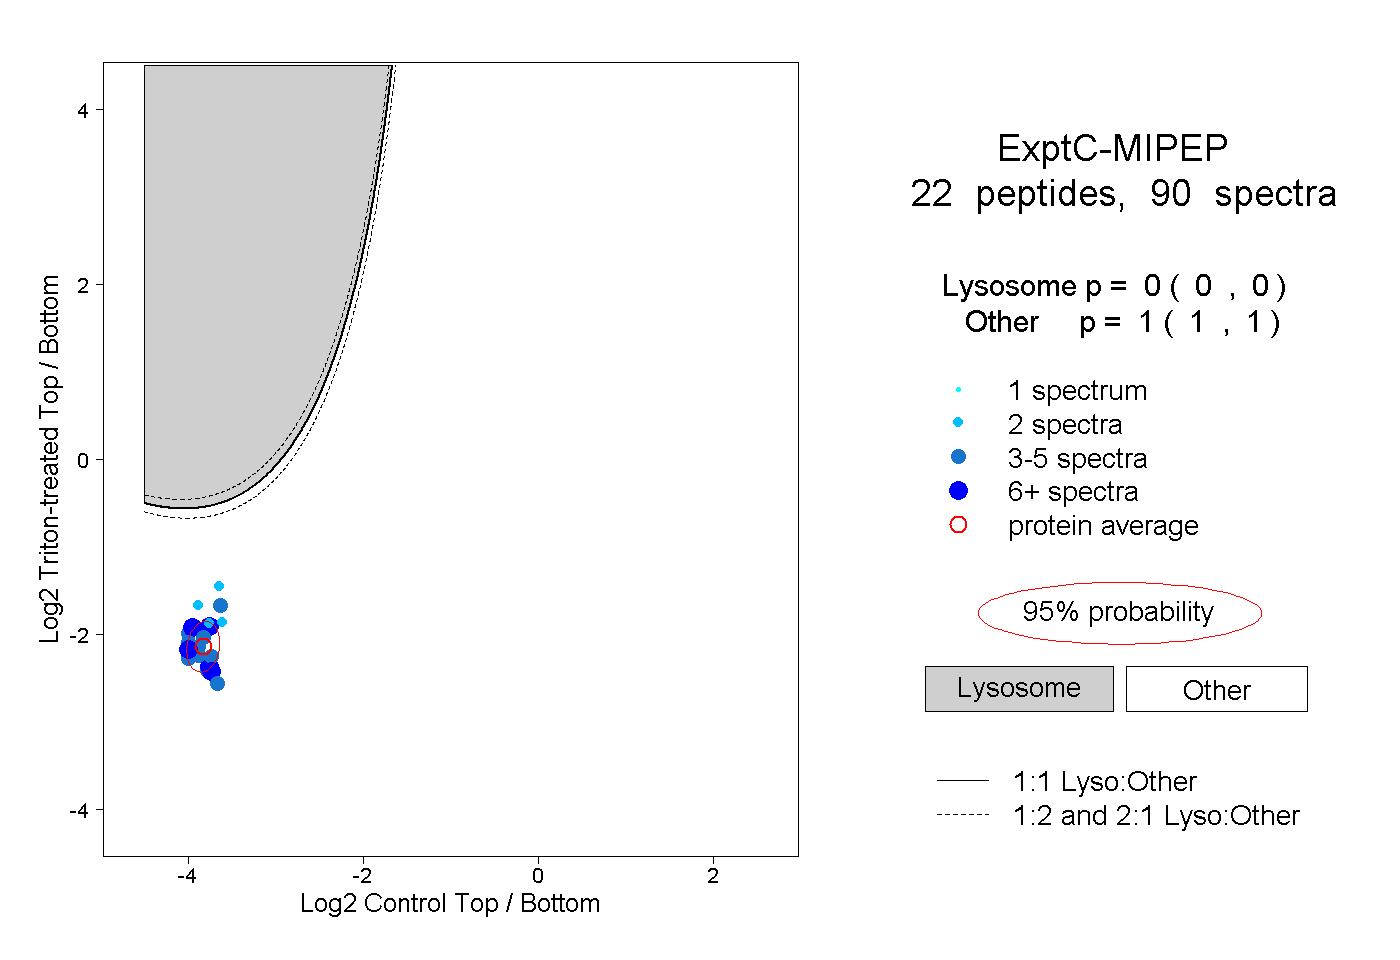
0.000 | 0.000
1.000 | 1.000
7peptides
spectra
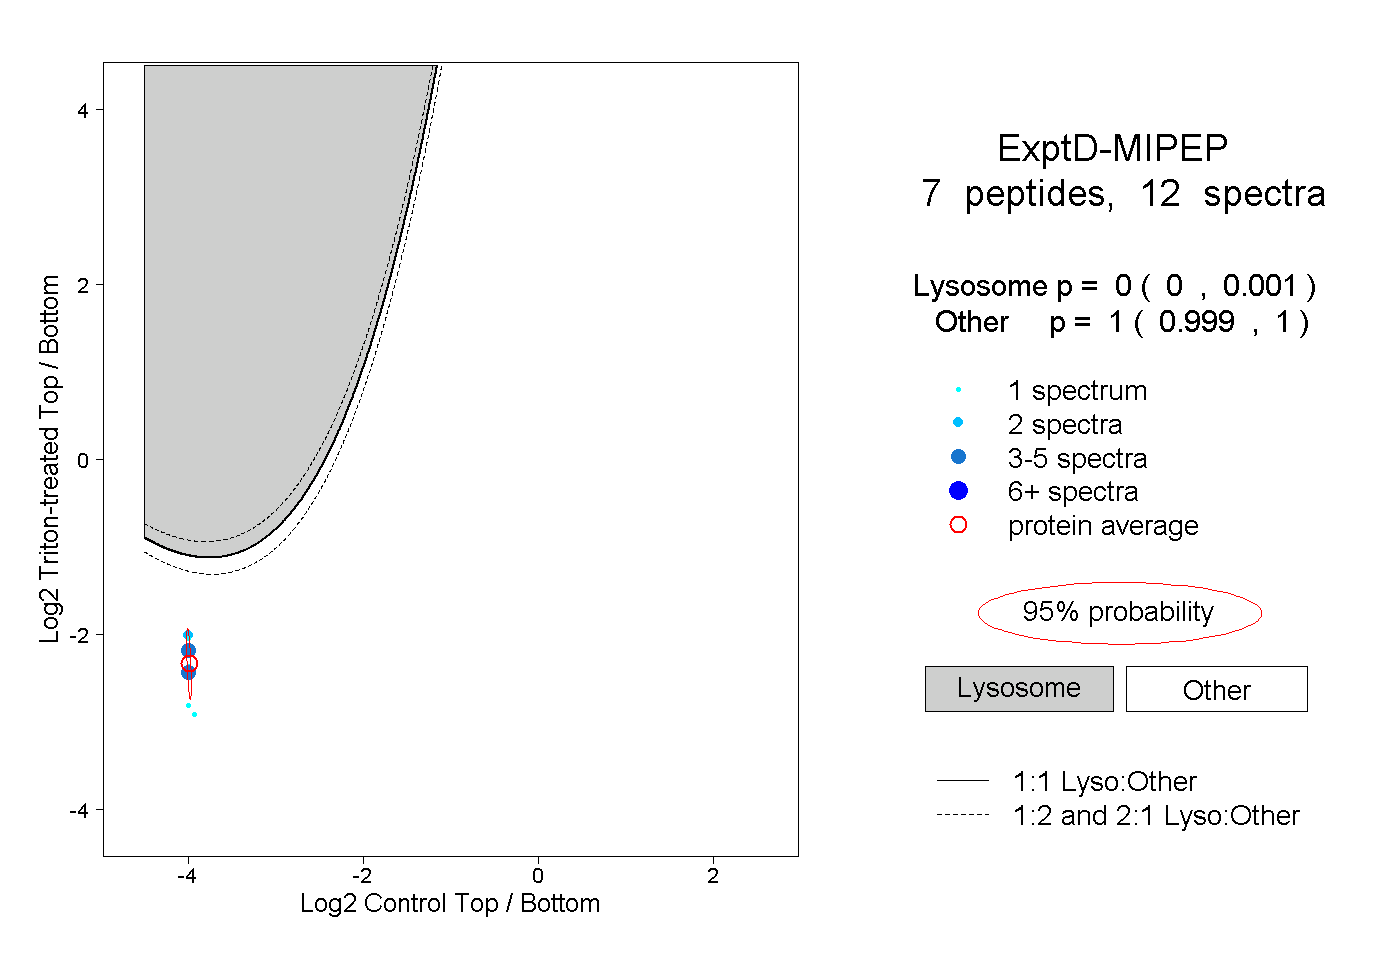
0.000 | 0.001
0.999 | 1.000