 2
2peptides
spectra
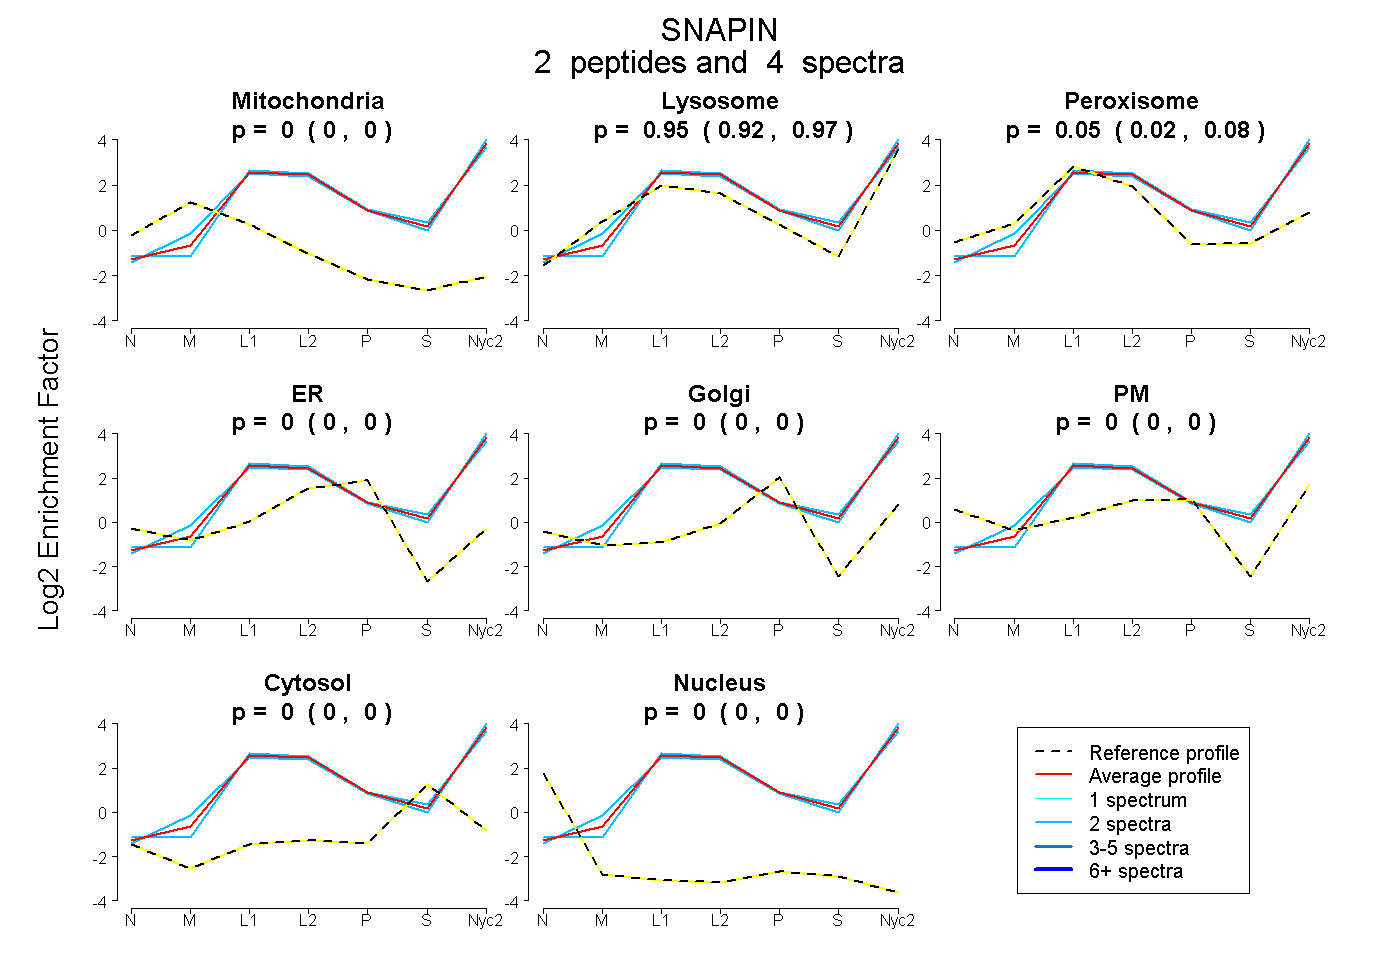
0.000 | 0.000
0.915 | 0.973
0.021 | 0.080
0.000 | 0.000
0.000 | 0.000
0.000 | 0.000
0.000 | 0.000
0.000 | 0.000
5peptides
spectra
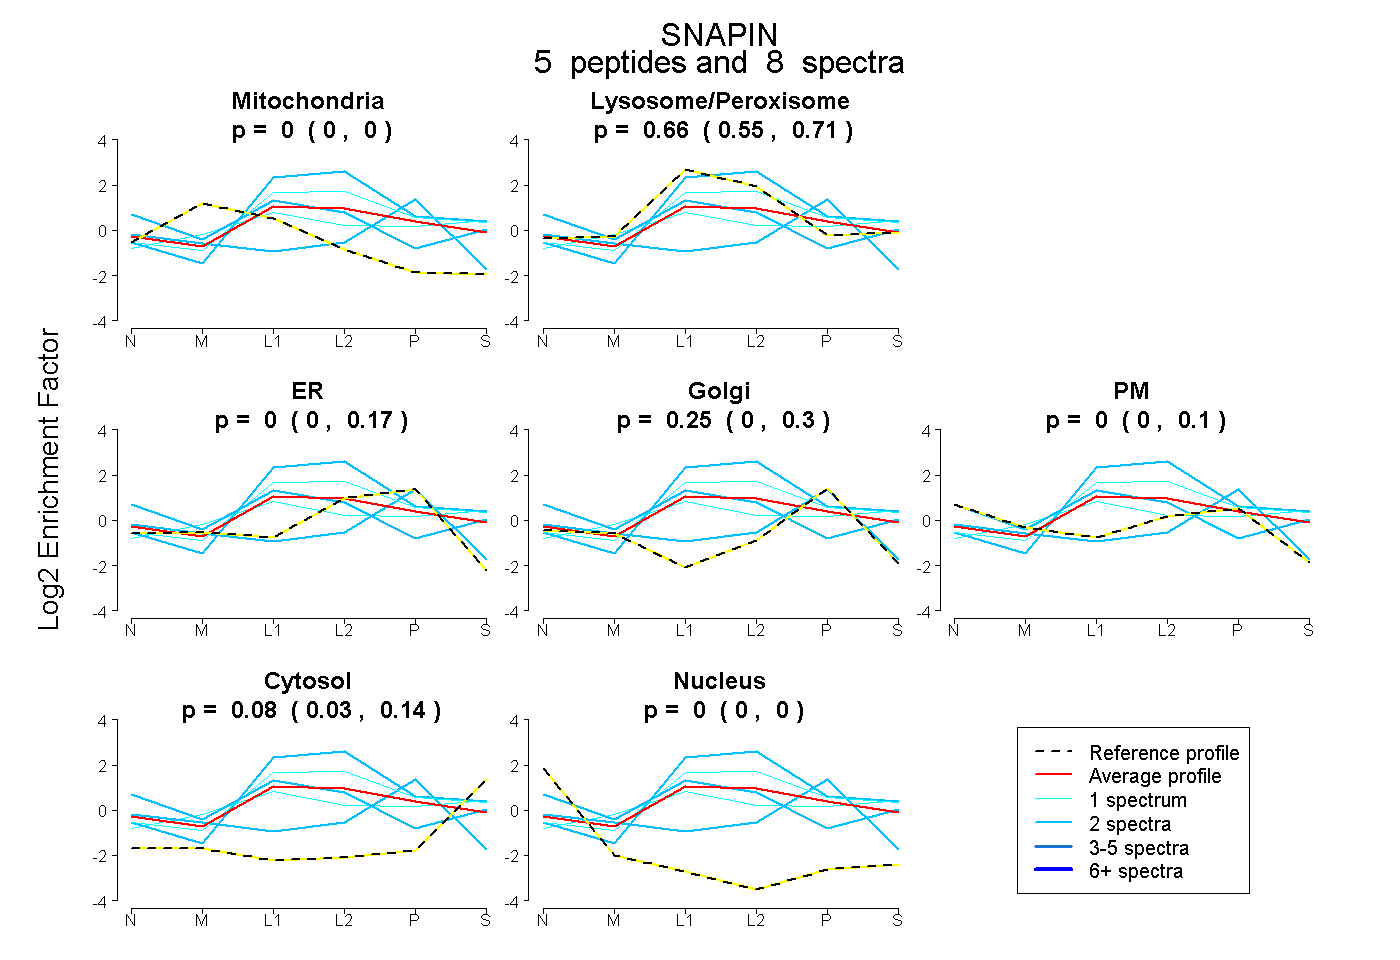
0.000 | 0.000
0.552 | 0.713
0.000 | 0.173
0.002 | 0.299
0.000 | 0.102
0.030 | 0.140
0.000 | 0.004
6peptides
spectra
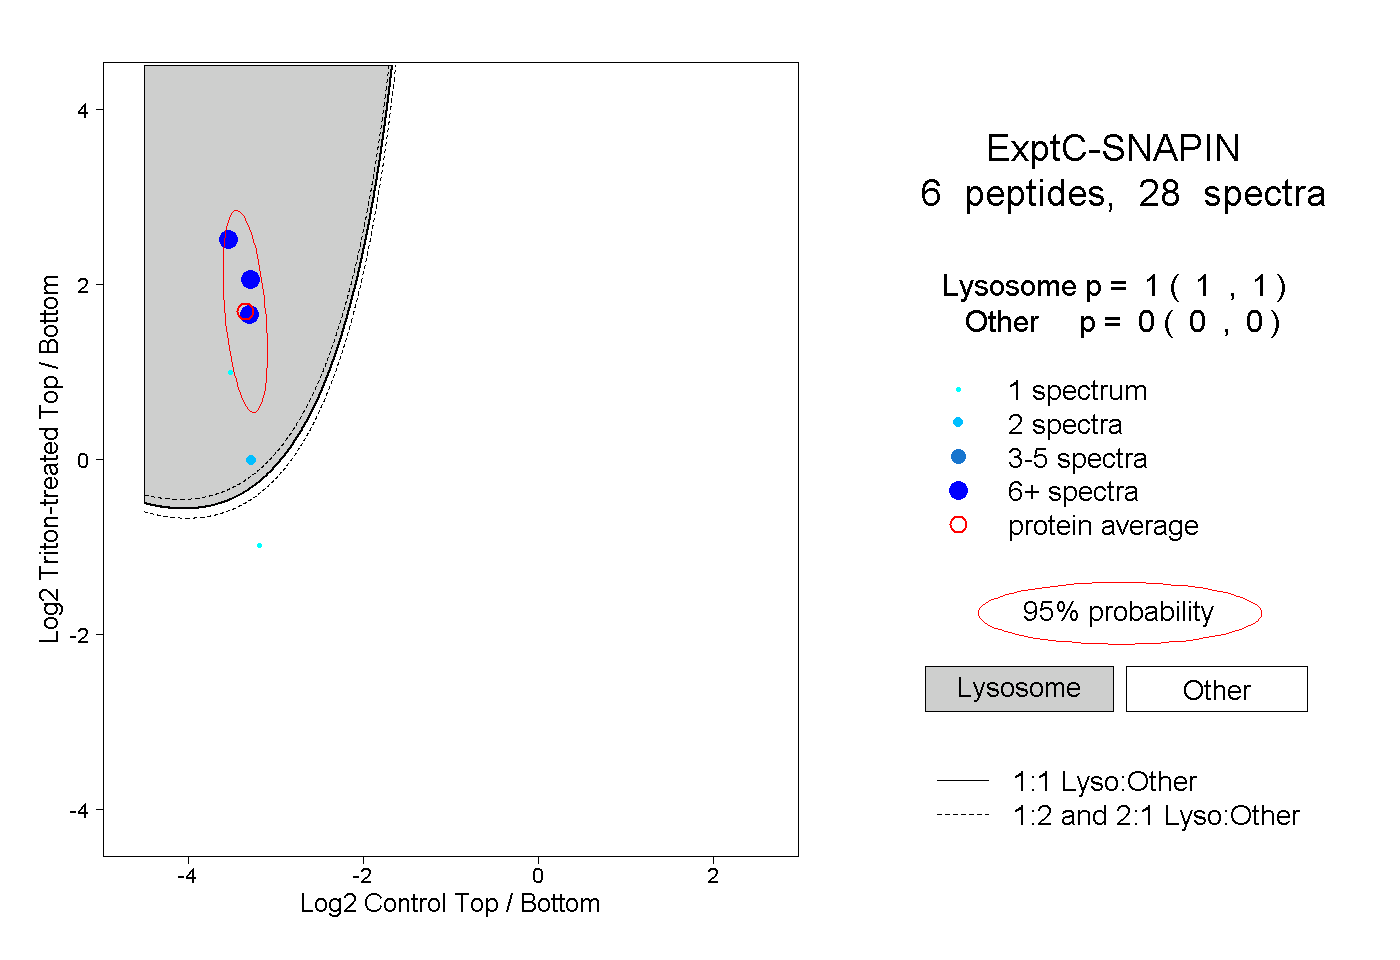
1.000 | 1.000
0.000 | 0.000
1peptide
spectrum
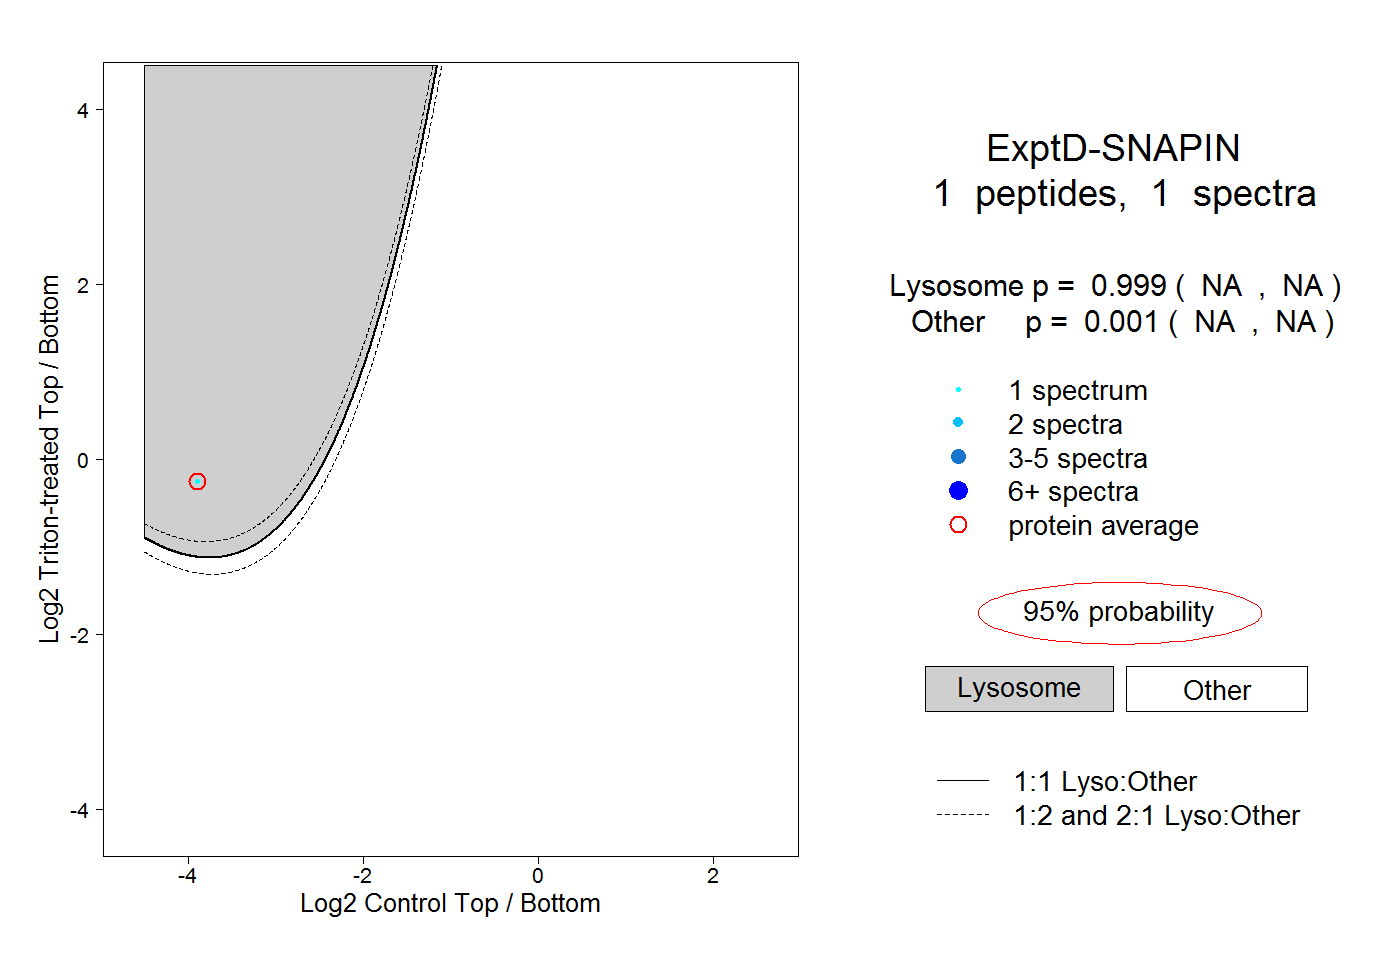
NA | NA
NA | NA