 5
5peptides
spectra

0.000 | 0.015
0.000 | 0.000
0.000 | 0.000
0.451 | 0.574
0.000 | 0.100
0.000 | 0.000
0.000 | 0.111
0.362 | 0.454
| Plot | Mito | Lyso | Perox | ER | Golgi | PM | Cytosol | Nucleus | |||||
| Expt A |
5 peptides |
7 spectra |
|
0.000 0.000 | 0.015 |
0.000 0.000 | 0.000 |
0.000 0.000 | 0.000 |
0.565 0.451 | 0.574 |
0.000 0.000 | 0.100 |
0.000 0.000 | 0.000 |
0.003 0.000 | 0.111 |
0.432 0.362 | 0.454 |
| 1 spectrum, VQDGNPVILLFR | 0.000 | 0.000 | 0.000 | 0.525 | 0.000 | 0.000 | 0.000 | 0.475 | ||
| 1 spectrum, FSPVLGR | 0.035 | 0.000 | 0.000 | 0.000 | 0.151 | 0.112 | 0.549 | 0.153 | ||
| 1 spectrum, LAVLMK | 0.063 | 0.000 | 0.000 | 0.570 | 0.000 | 0.000 | 0.000 | 0.367 | ||
| 2 spectra, FAVALLDDSIR | 0.207 | 0.000 | 0.000 | 0.334 | 0.000 | 0.000 | 0.459 | 0.000 | ||
| 2 spectra, VLATTPSAVFR | 0.000 | 0.000 | 0.000 | 0.486 | 0.000 | 0.000 | 0.000 | 0.514 |
| Plot | Mito | Lyso or Perox | ER | Golgi | PM | Cytosol | Nucleus | ||||||
| Expt B |
2 peptides |
2 spectra |
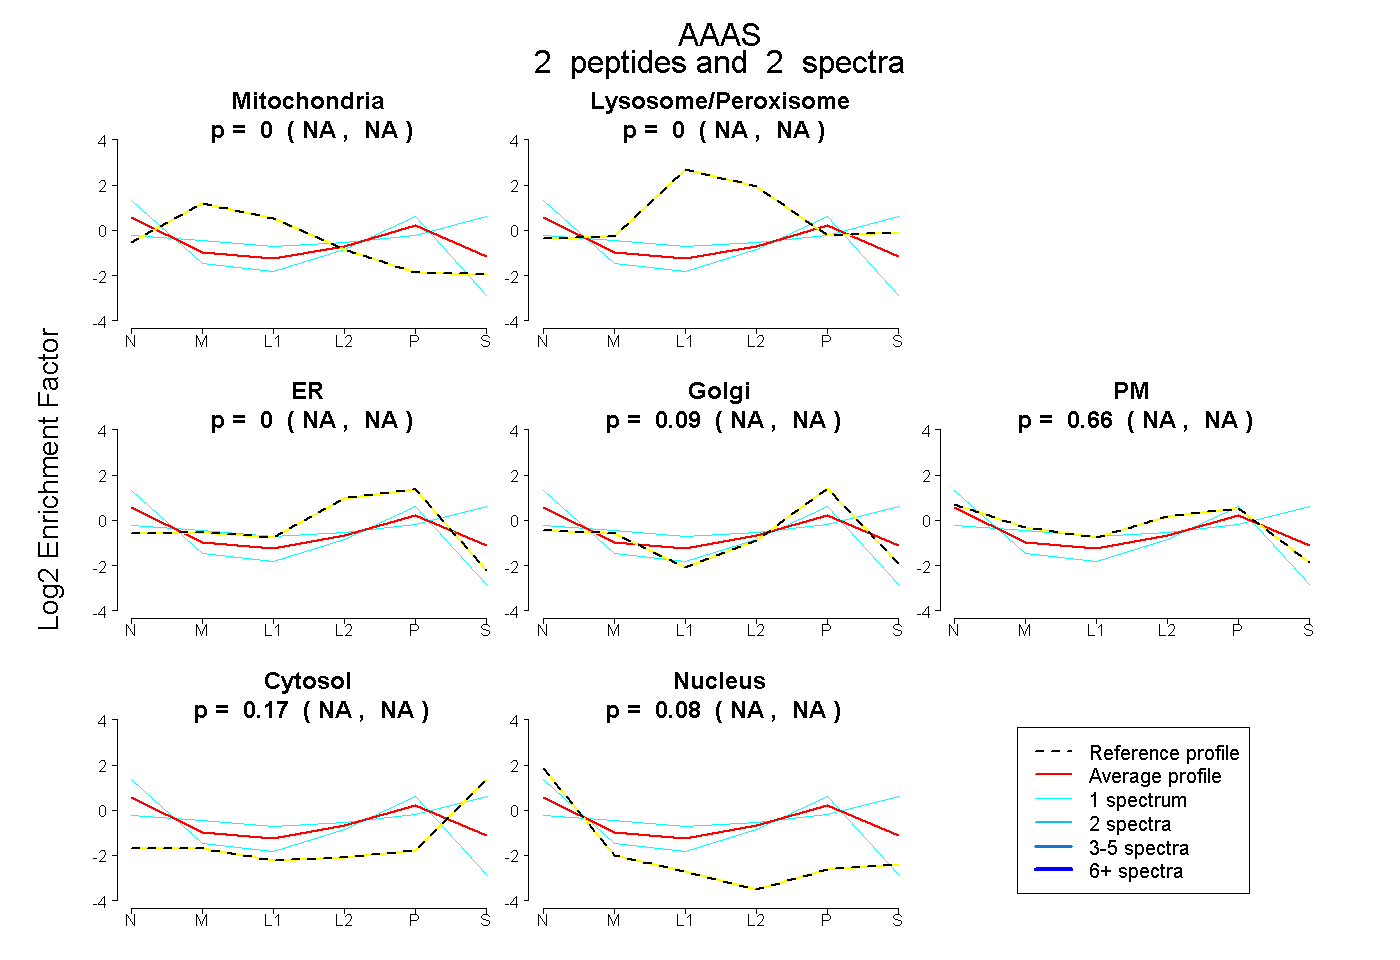 |
0.000 NA | NA |
0.000 NA | NA |
0.000 NA | NA |
0.086 NA | NA |
0.659 NA | NA |
0.171 NA | NA |
0.084 NA | NA |
|||
| Plot | Lyso | Other | |||||||||||
| Expt C |
2 peptides |
4 spectra |
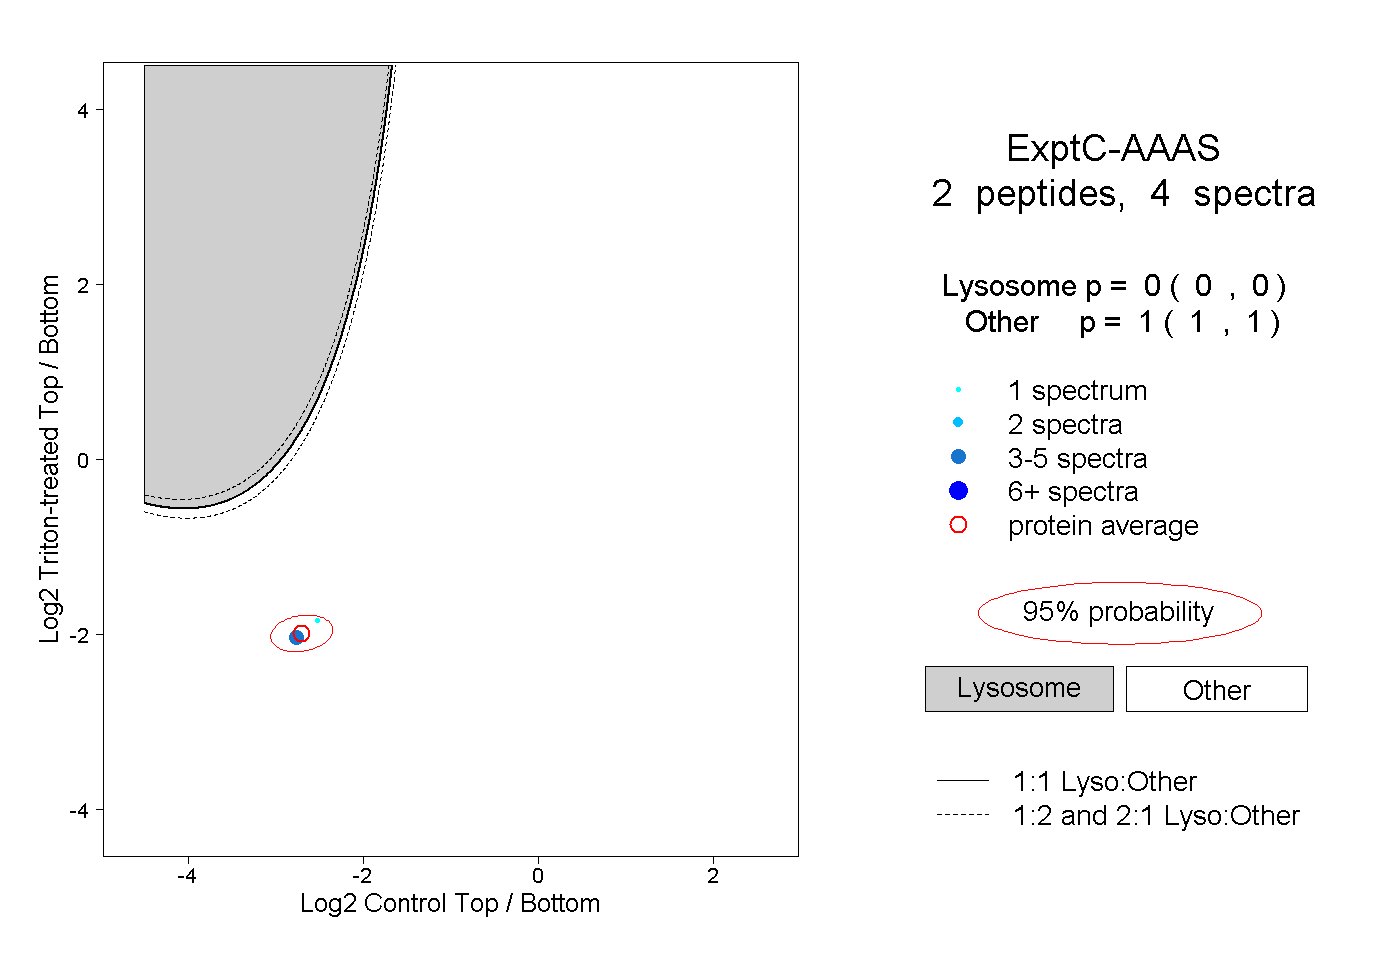 |
0.000 0.000 | 0.000 |
1.000 1.000 | 1.000 |