 5
5peptides
spectra

0.000 | 0.015
0.000 | 0.000
0.000 | 0.000
0.451 | 0.574
0.000 | 0.100
0.000 | 0.000
0.000 | 0.111
0.362 | 0.454
2peptides
spectra
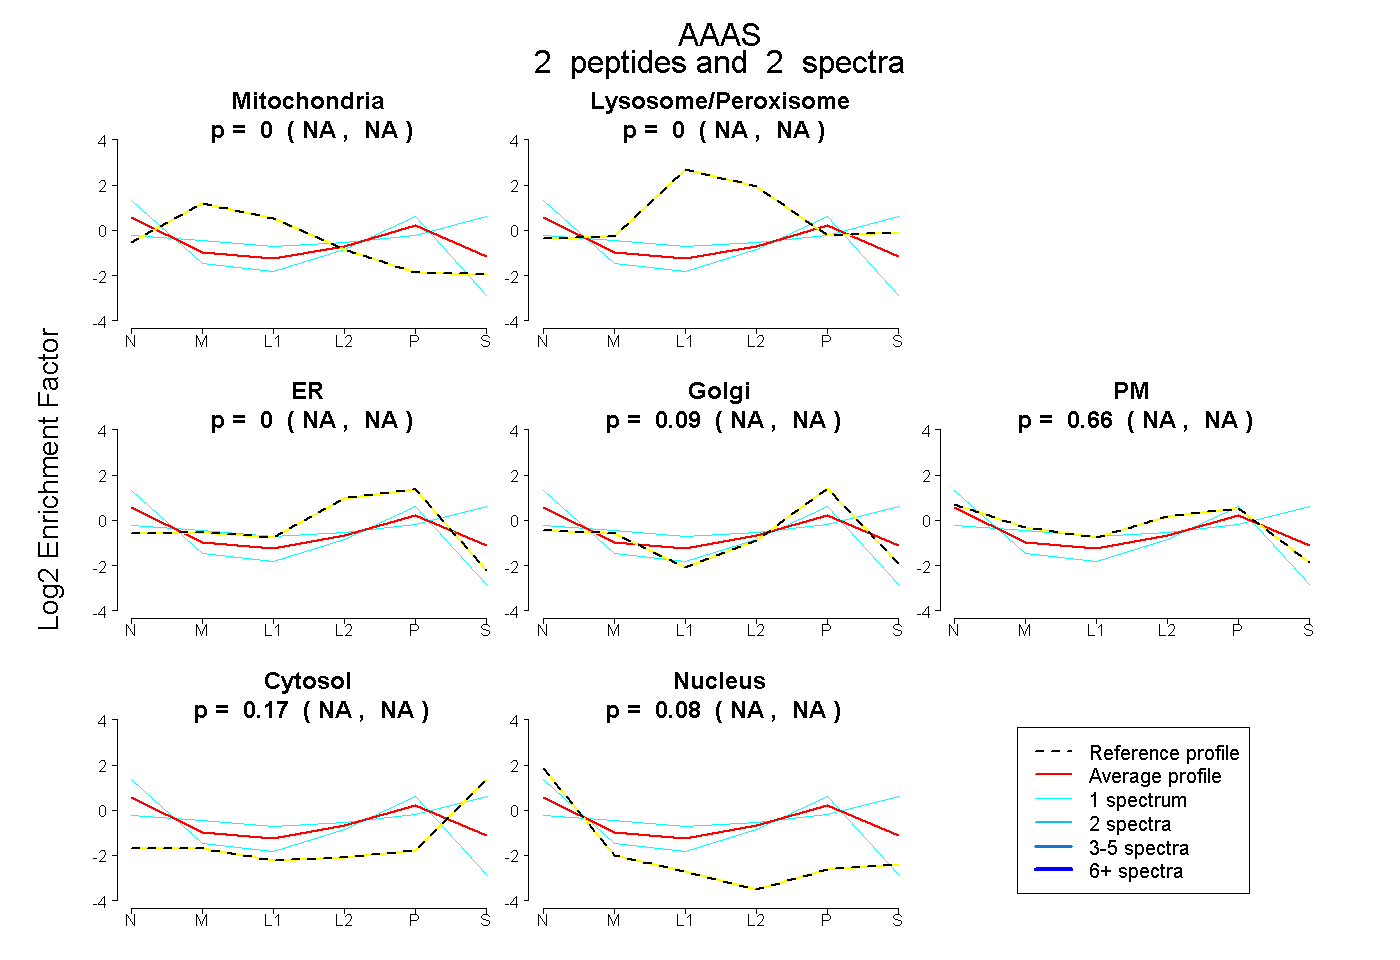
NA | NA
NA | NA
NA | NA
NA | NA
NA | NA
NA | NA
NA | NA
2peptides
spectra
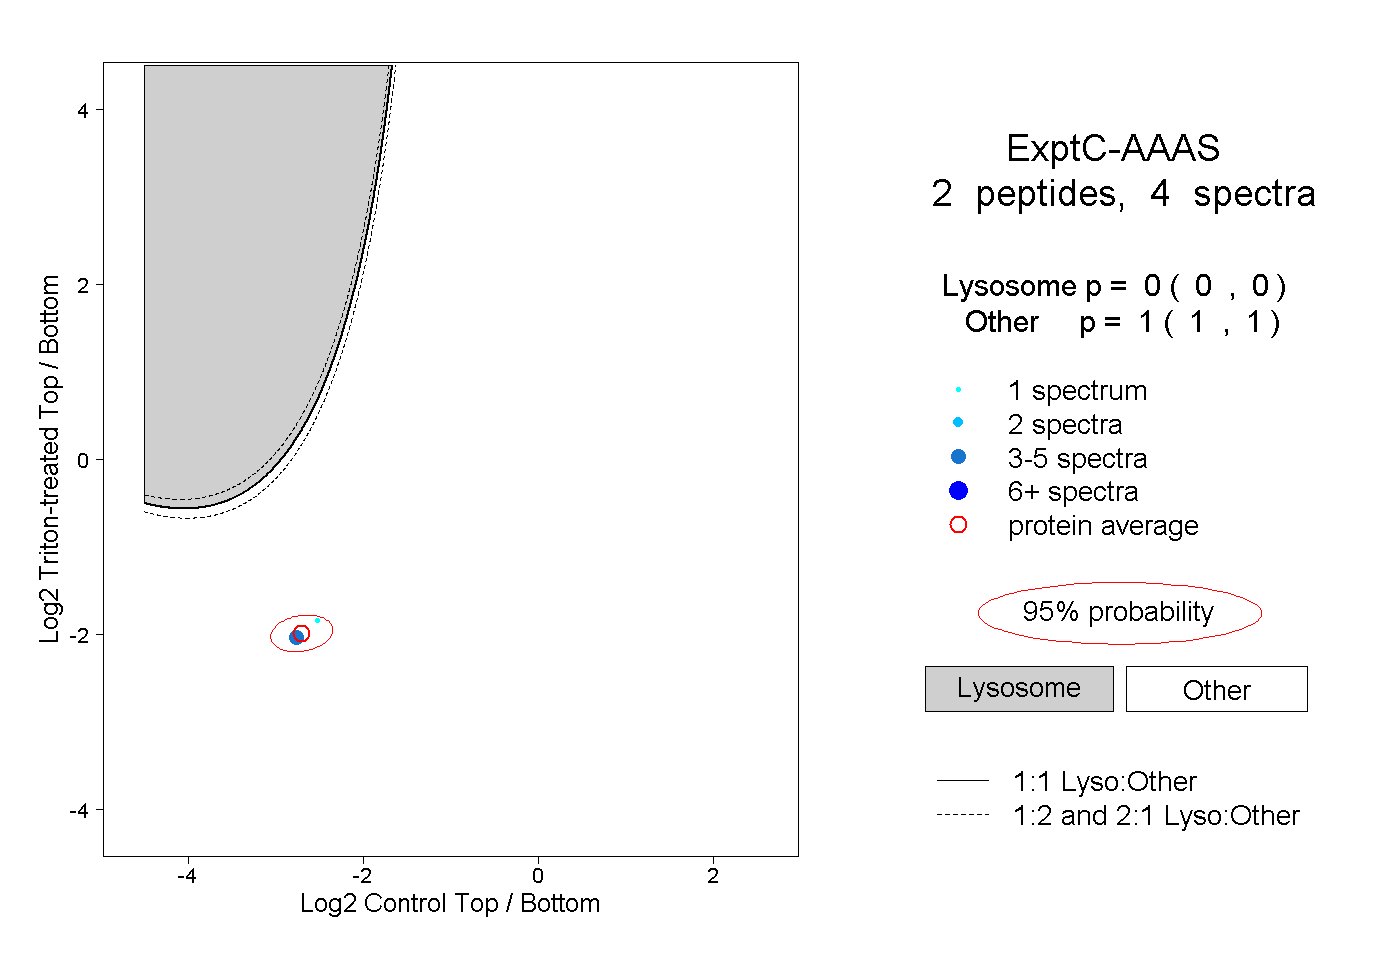
0.000 | 0.000
1.000 | 1.000