 9
9peptides
spectra
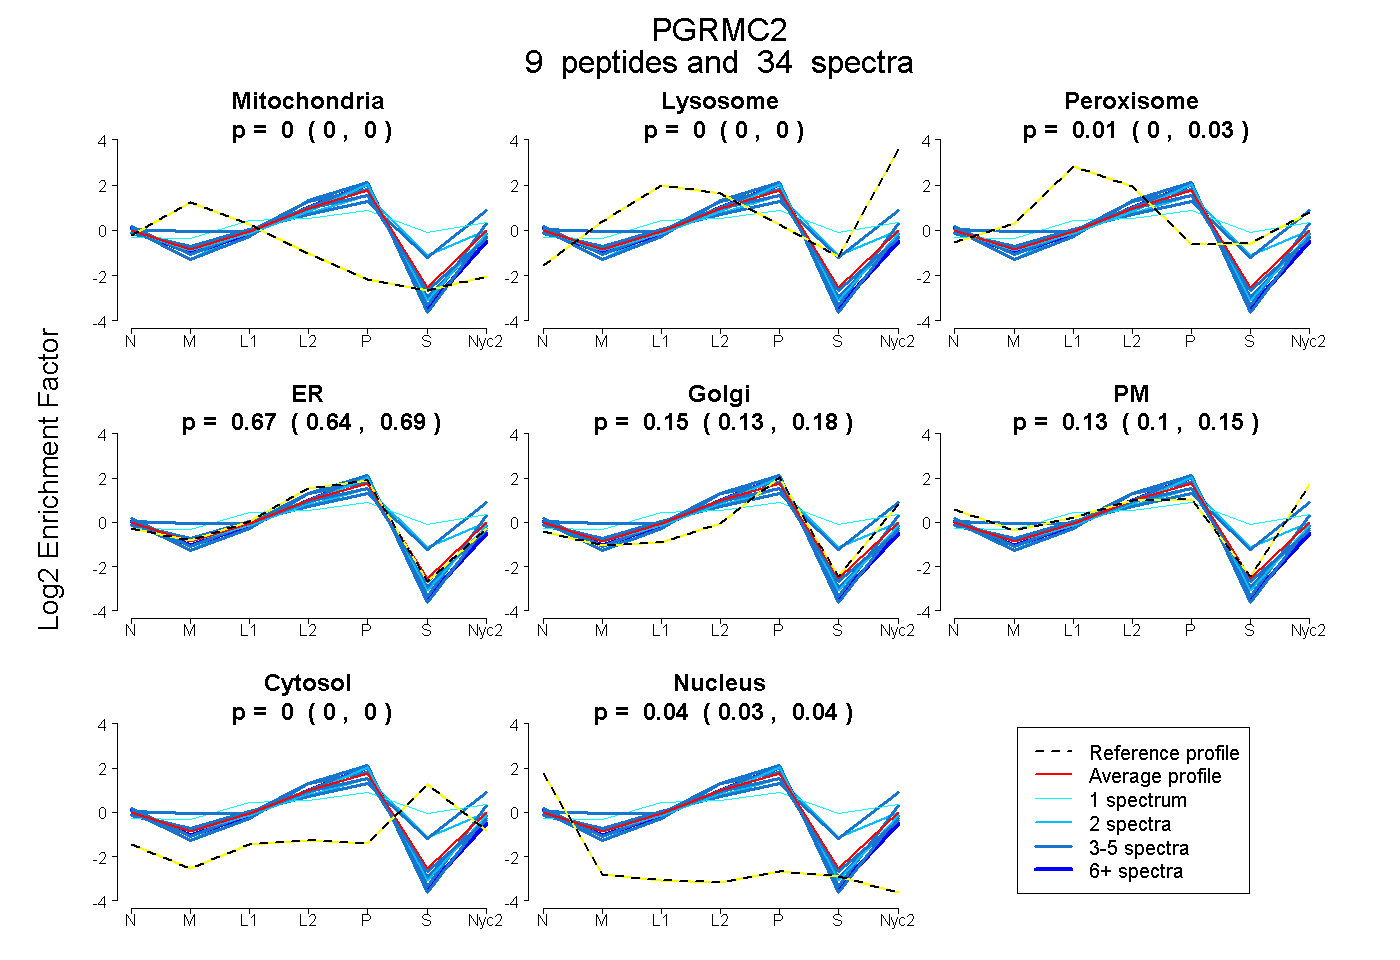
0.000 | 0.002
0.000 | 0.000
0.000 | 0.027
0.641 | 0.695
0.127 | 0.183
0.096 | 0.152
0.000 | 0.000
0.030 | 0.040
6peptides
spectra
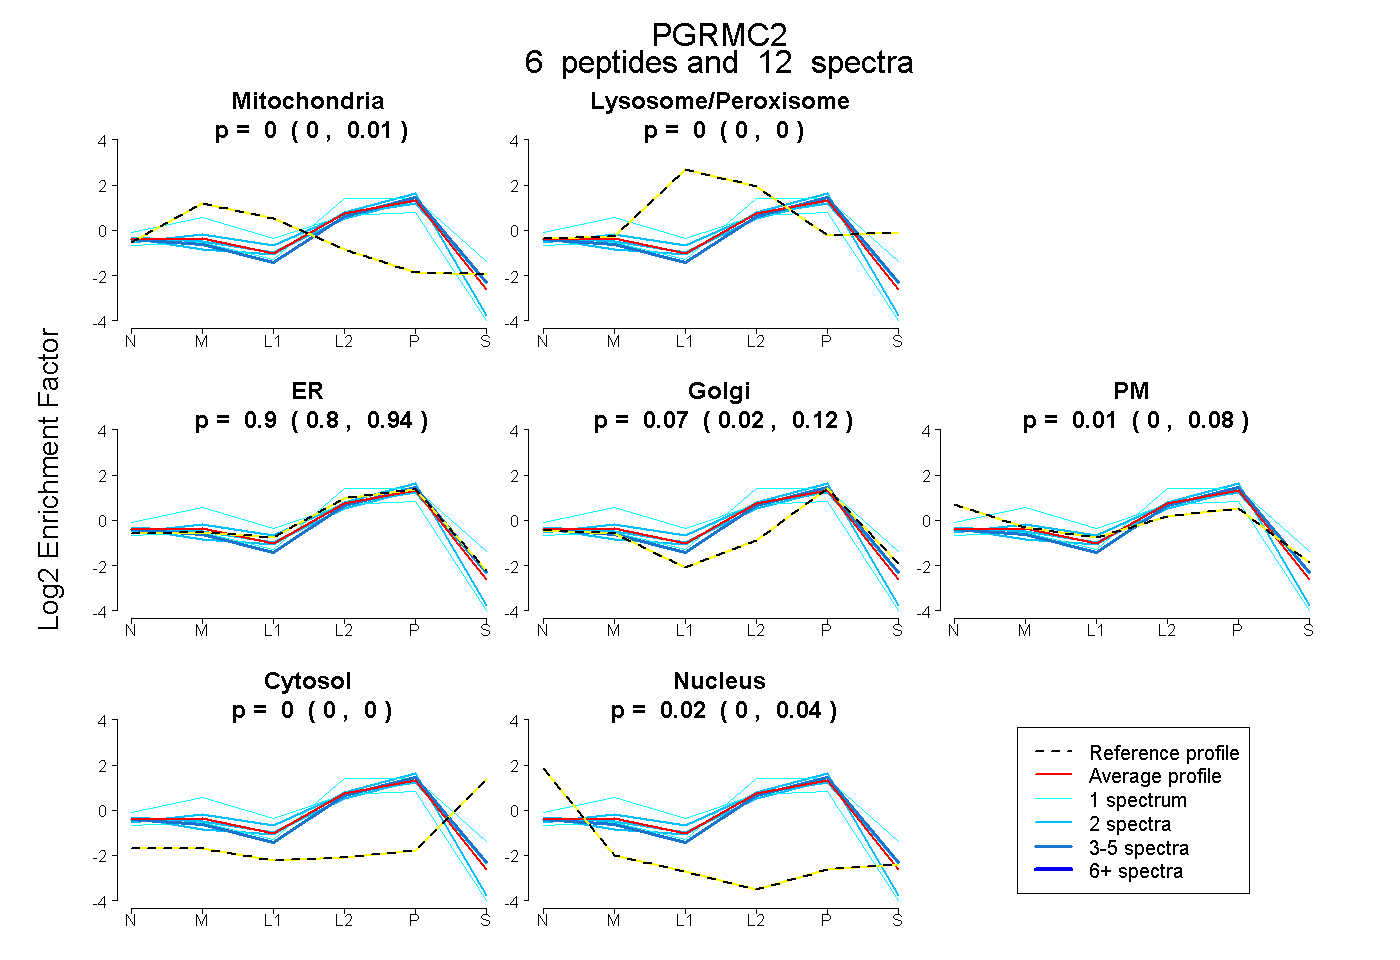
0.000 | 0.008
0.000 | 0.000
0.802 | 0.937
0.018 | 0.117
0.000 | 0.082
0.000 | 0.000
0.000 | 0.037
9peptides
spectra
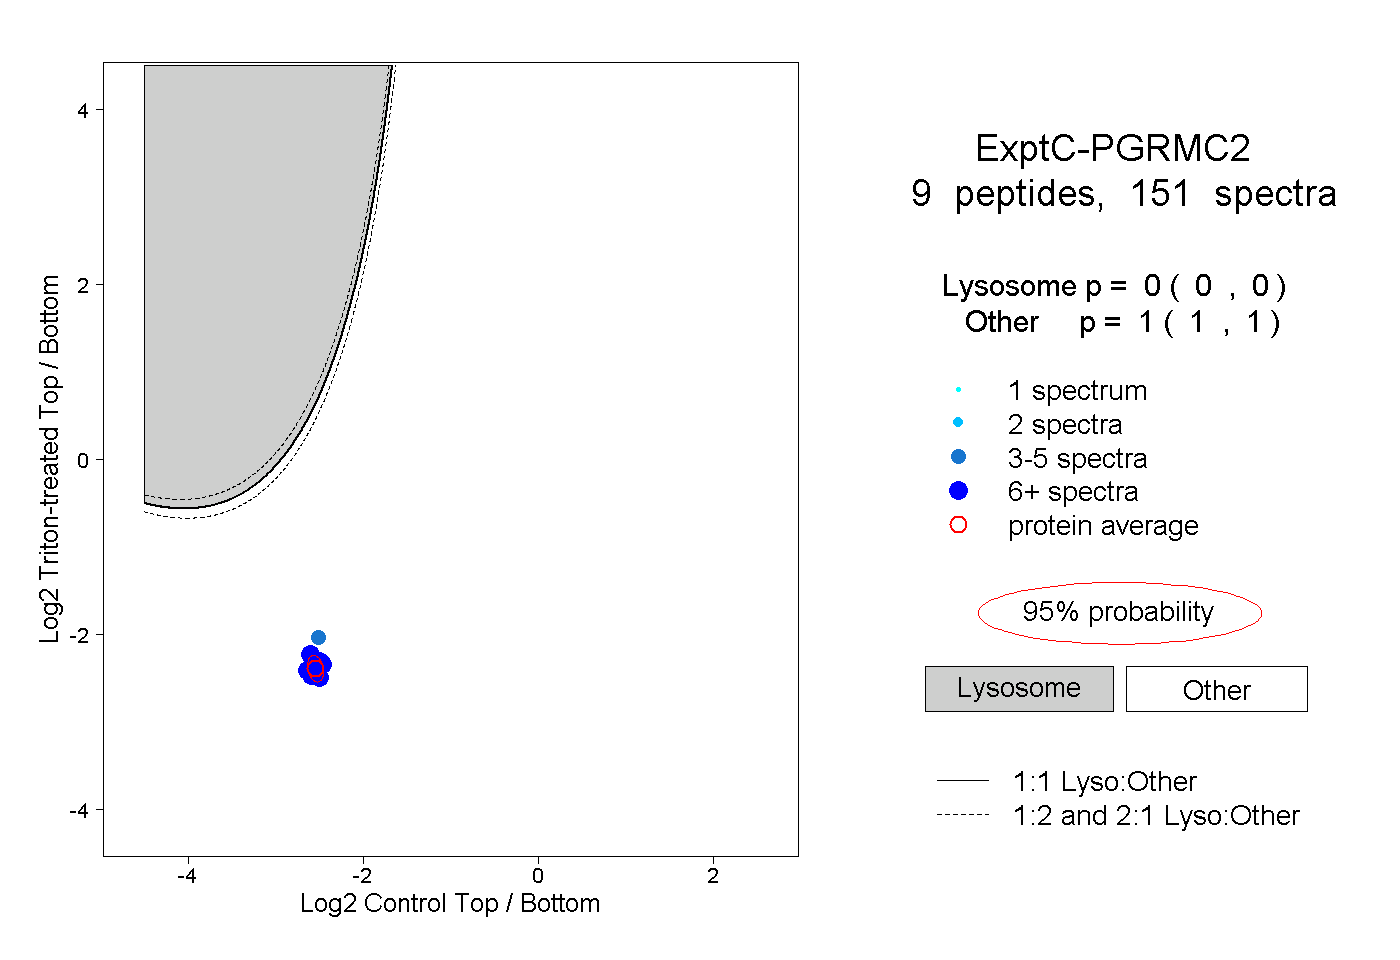
0.000 | 0.000
1.000 | 1.000
6peptides
spectra

0.000 | 0.000
1.000 | 1.000