18
18peptides
spectra
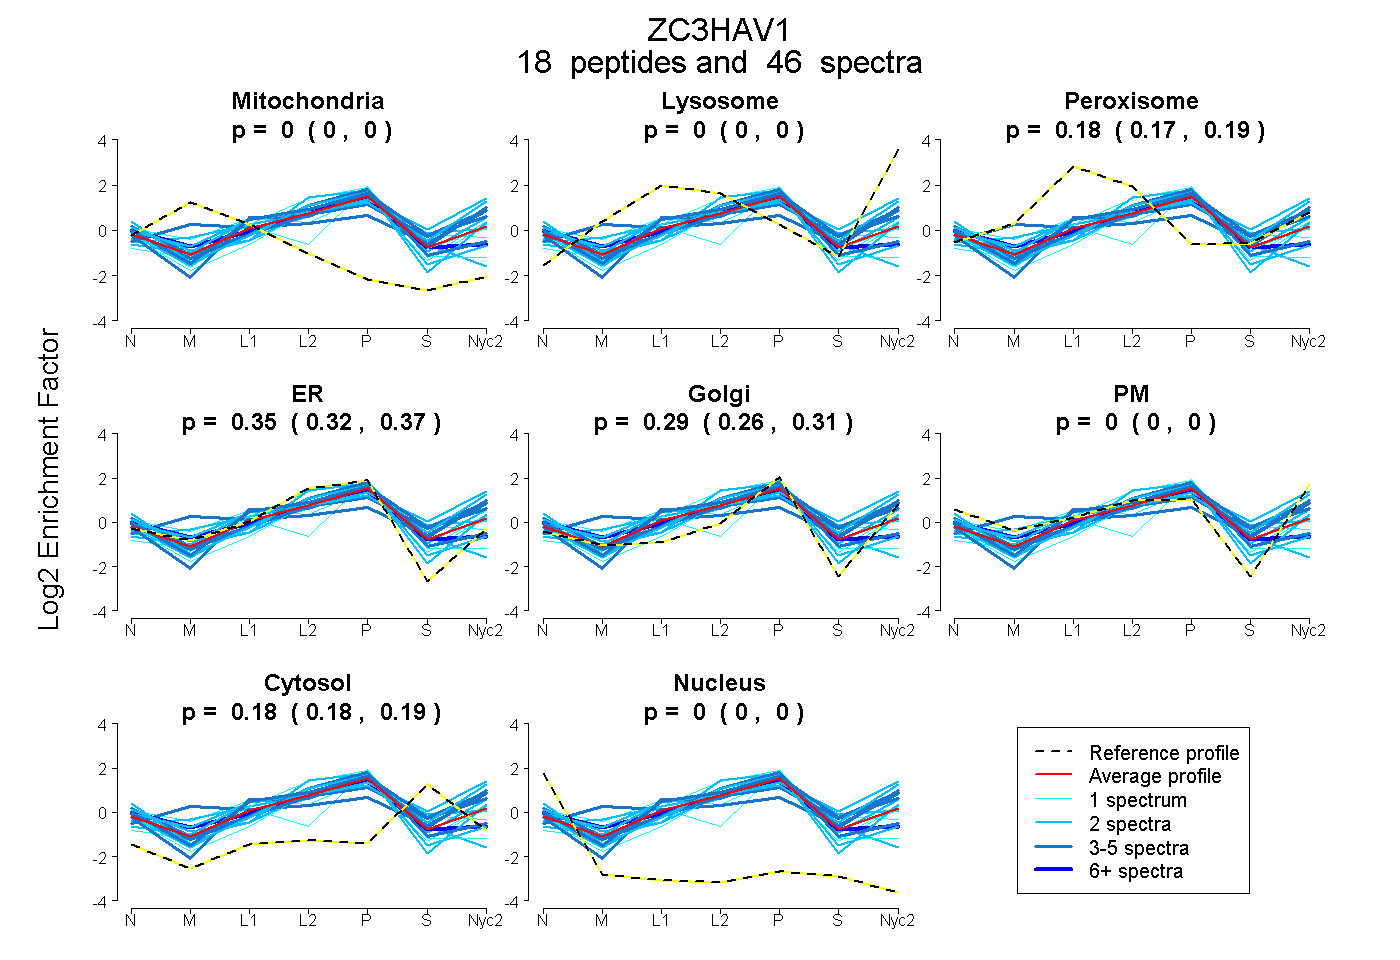
0.000 | 0.000
0.000 | 0.000
0.170 | 0.189
0.318 | 0.371
0.260 | 0.311
0.000 | 0.000
0.176 | 0.191
0.000 | 0.000
7peptides
spectra
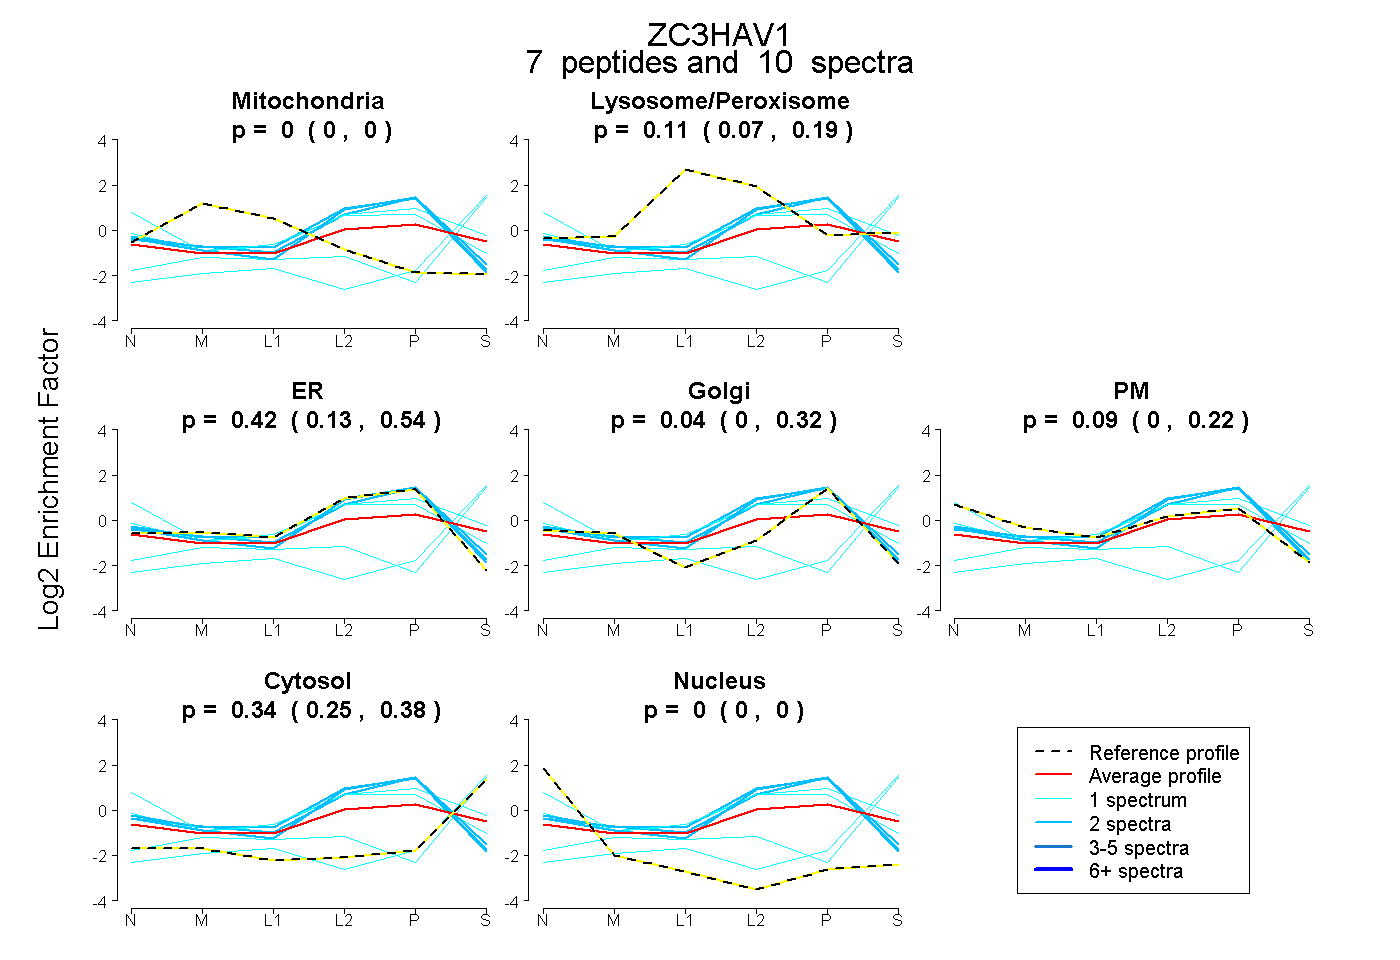
0.000 | 0.000
0.068 | 0.188
0.130 | 0.541
0.000 | 0.319
0.000 | 0.224
0.252 | 0.379
0.000 | 0.003
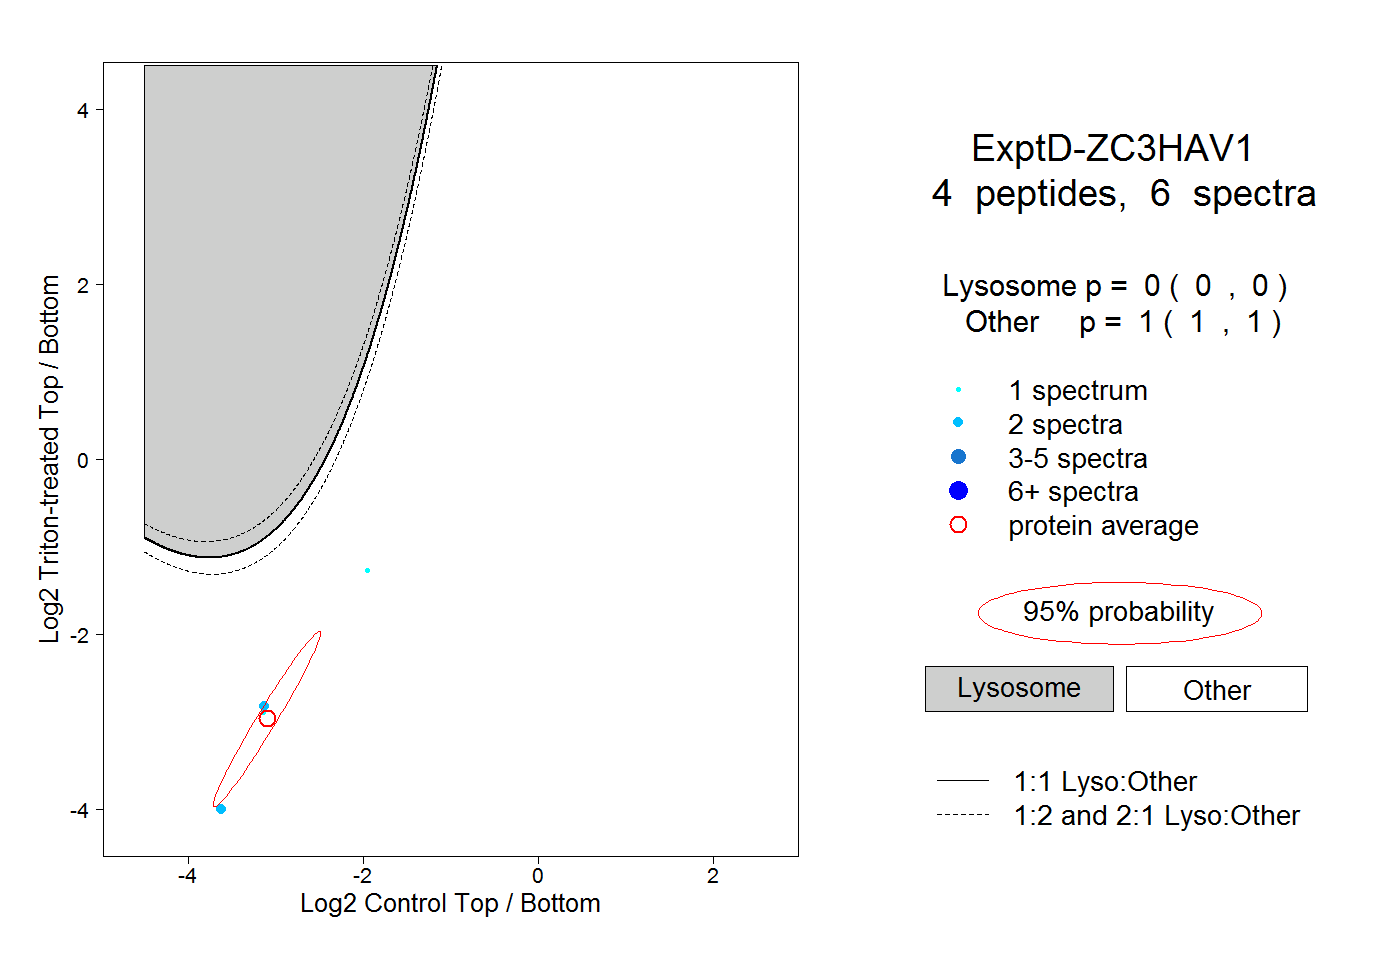
16peptides
spectra
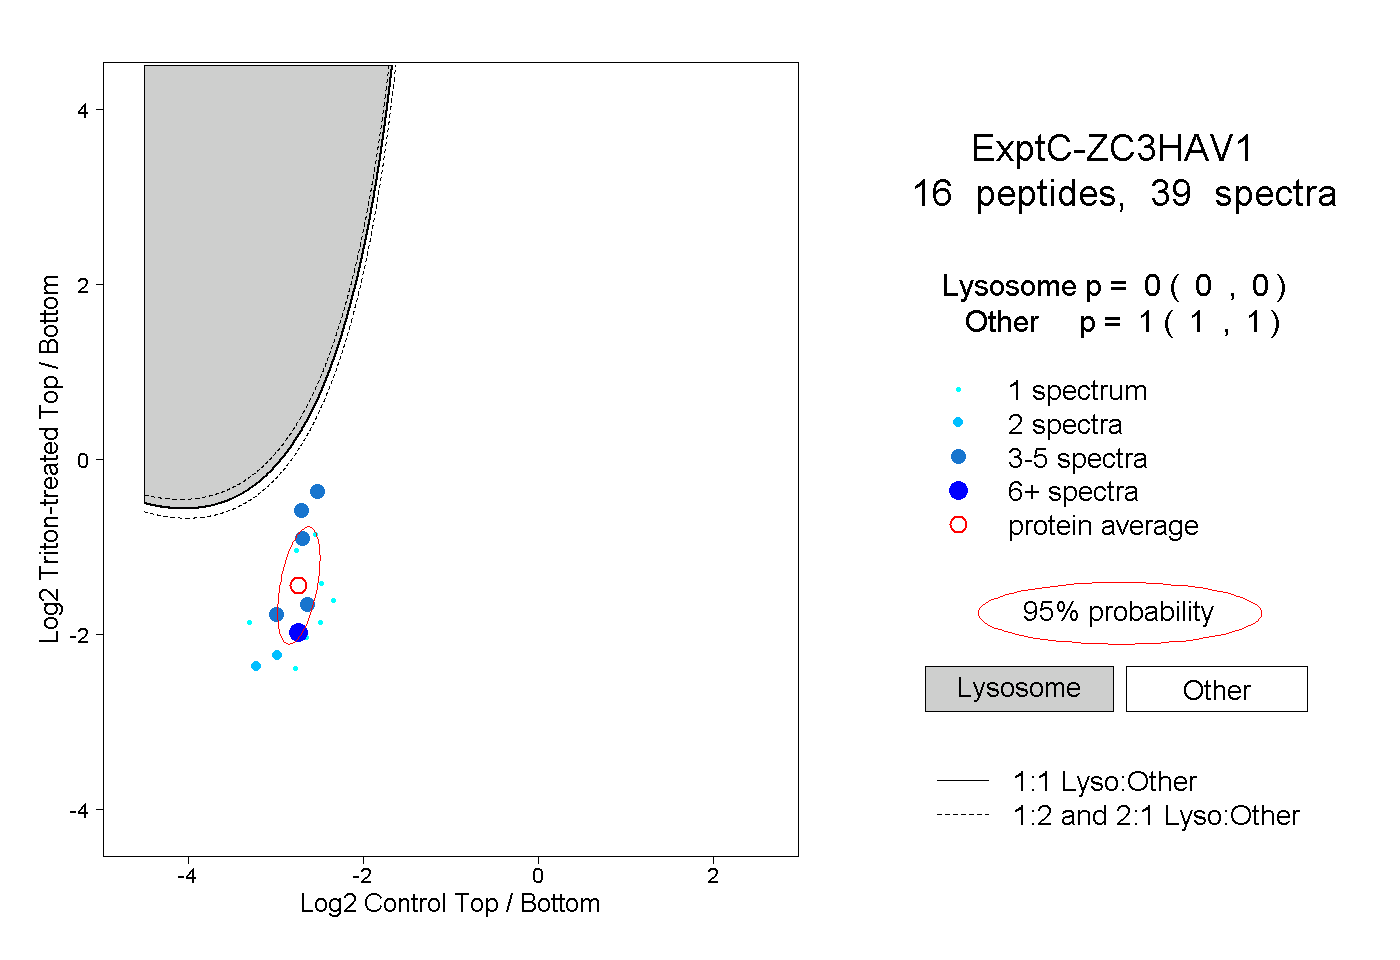
0.000 | 0.000
1.000 | 1.000