 15
15peptides
spectra
0.871 | 0.877
0.000 | 0.000
0.000 | 0.000
0.000 | 0.000
0.000 | 0.000
0.000 | 0.000
0.000 | 0.000
0.123 | 0.129
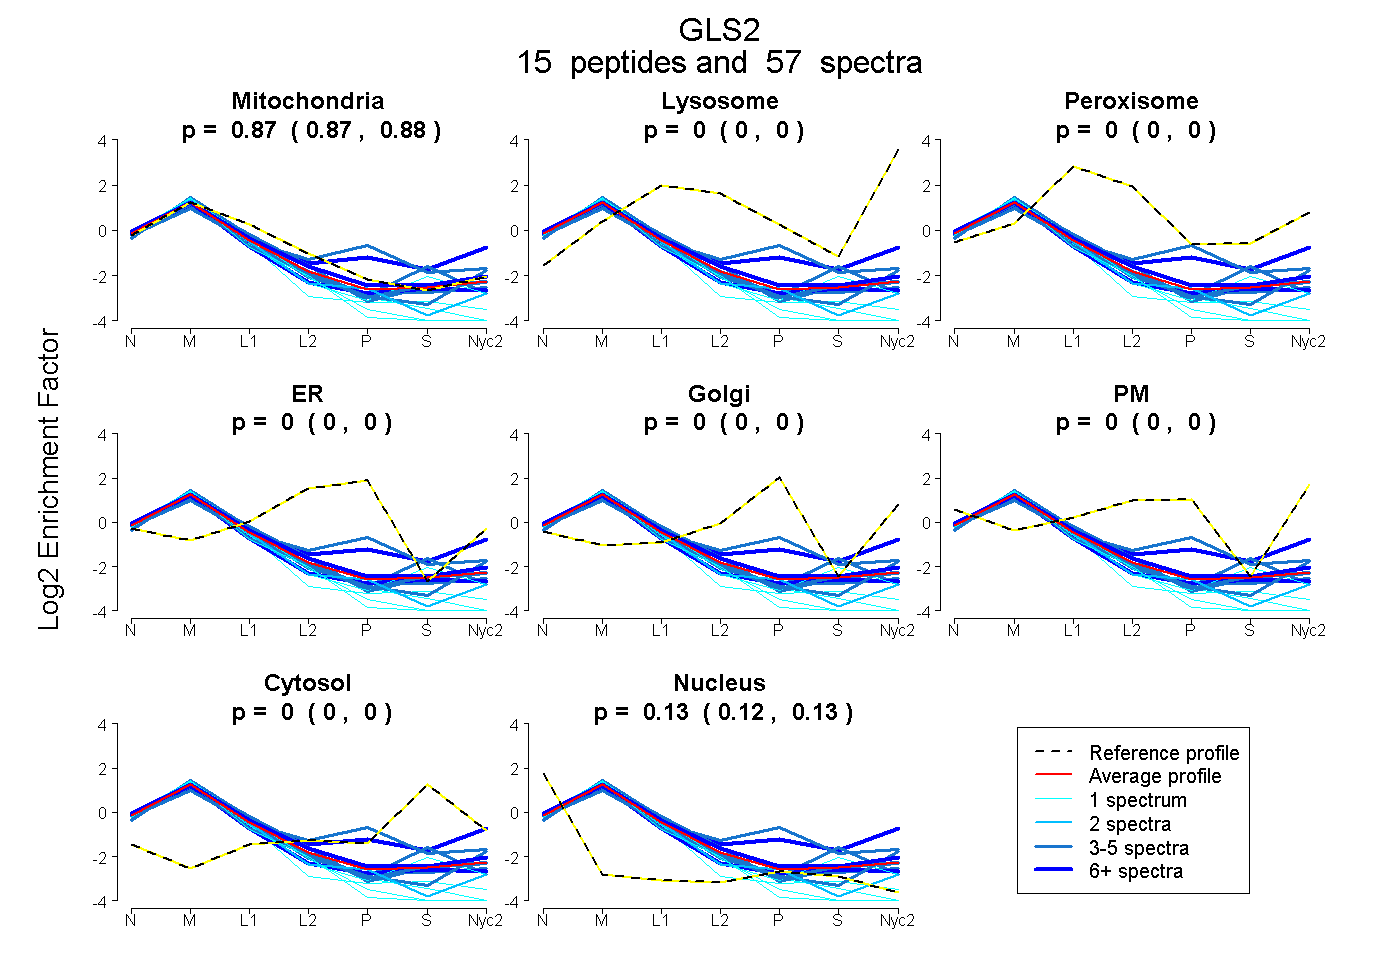
| Plot | Mito | Lyso | Perox | ER | Golgi | PM | Cytosol | Nucleus | |||||
| Expt A |
15 peptides |
57 spectra |
|
0.874 0.871 | 0.877 |
0.000 0.000 | 0.000 |
0.000 0.000 | 0.000 |
0.000 0.000 | 0.000 |
0.000 0.000 | 0.000 |
0.000 0.000 | 0.000 |
0.000 0.000 | 0.000 |
0.126 0.123 | 0.129 |
| 1 spectrum, SNPDLWGVSLCTVDGQR | 0.791 | 0.000 | 0.000 | 0.000 | 0.000 | 0.000 | 0.000 | 0.209 | ||
| 6 spectra, FVIPDFEEFTGHVDR | 0.803 | 0.000 | 0.000 | 0.000 | 0.000 | 0.000 | 0.000 | 0.197 | ||
| 1 spectrum, LQDCMSK | 0.806 | 0.000 | 0.000 | 0.000 | 0.000 | 0.000 | 0.000 | 0.194 | ||
| 5 spectra, EPSGLR | 0.906 | 0.000 | 0.000 | 0.000 | 0.000 | 0.000 | 0.000 | 0.094 | ||
| 5 spectra, FALSAVDMEQK | 0.856 | 0.000 | 0.000 | 0.000 | 0.000 | 0.000 | 0.000 | 0.144 | ||
| 4 spectra, MVQESSSGGLLDR | 0.932 | 0.000 | 0.000 | 0.000 | 0.000 | 0.000 | 0.000 | 0.068 | ||
| 6 spectra, ENLESMV | 0.688 | 0.047 | 0.000 | 0.000 | 0.154 | 0.000 | 0.110 | 0.000 | ||
| 1 spectrum, CVSSNIVLLTQAFR | 0.781 | 0.000 | 0.000 | 0.000 | 0.000 | 0.000 | 0.000 | 0.219 | ||
| 4 spectra, MAGNEFMGFSNATFQSEK | 0.857 | 0.000 | 0.000 | 0.000 | 0.000 | 0.000 | 0.000 | 0.143 | ||
| 4 spectra, GISFCQK | 0.690 | 0.000 | 0.000 | 0.000 | 0.216 | 0.000 | 0.075 | 0.019 | ||
| 1 spectrum, TALHVAAAEGHIDVVK | 0.769 | 0.000 | 0.000 | 0.000 | 0.000 | 0.000 | 0.000 | 0.231 | ||
| 4 spectra, FLIEACK | 0.793 | 0.000 | 0.000 | 0.000 | 0.000 | 0.000 | 0.061 | 0.146 | ||
| 2 spectra, NYAIGYYLK | 0.827 | 0.000 | 0.000 | 0.000 | 0.000 | 0.000 | 0.000 | 0.173 | ||
| 12 spectra, VAAYIPHLAK | 0.899 | 0.000 | 0.000 | 0.000 | 0.000 | 0.000 | 0.005 | 0.097 | ||
| 1 spectrum, ATGLQTSDPR | 0.746 | 0.000 | 0.000 | 0.000 | 0.000 | 0.000 | 0.000 | 0.254 |
| Plot | Mito | Lyso or Perox | ER | Golgi | PM | Cytosol | Nucleus | ||||||
| Expt B |
11 peptides |
43 spectra |
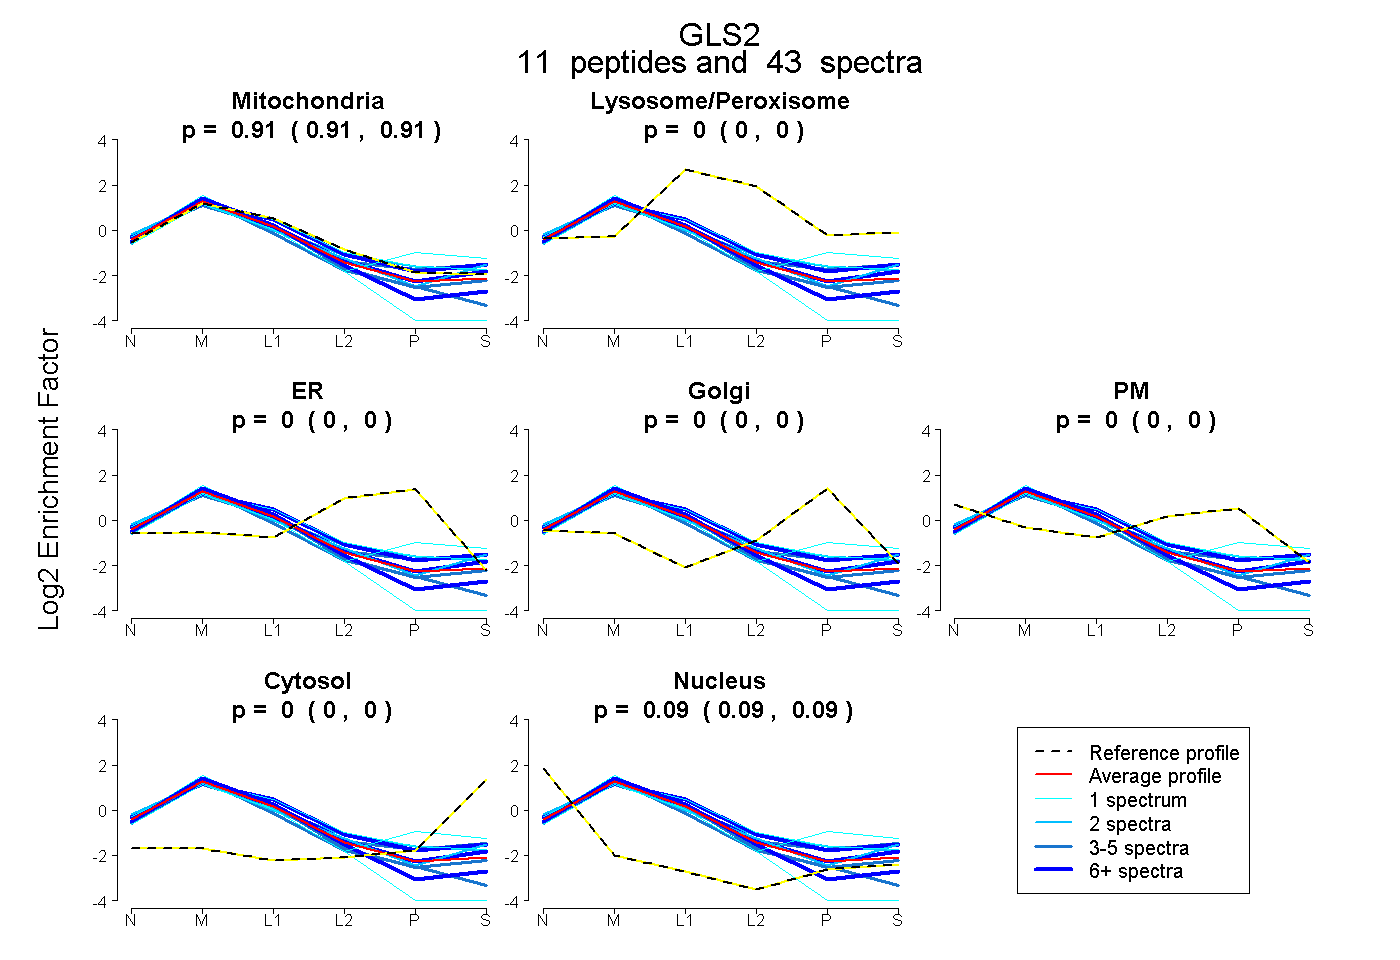 |
0.909 0.905 | 0.912 |
0.000 0.000 | 0.000 |
0.000 0.000 | 0.000 |
0.000 0.000 | 0.000 |
0.000 0.000 | 0.000 |
0.000 0.000 | 0.000 |
0.091 0.088 | 0.094 |
|||
| Plot | Lyso | Other | |||||||||||
| Expt C |
26 peptides |
261 spectra |
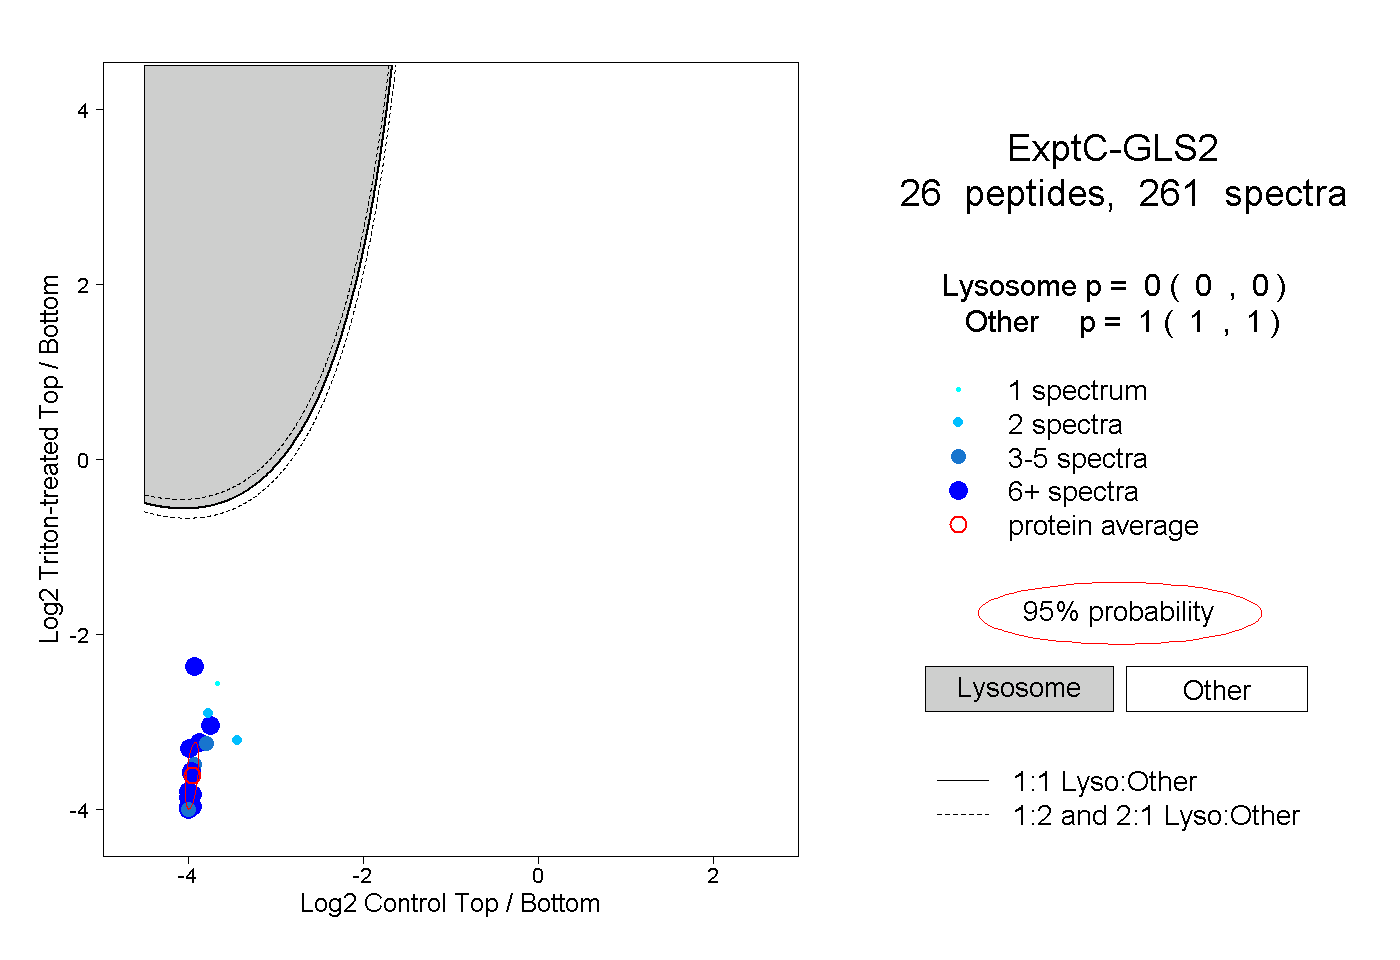 |
0.000 0.000 | 0.000 |
1.000 1.000 | 1.000 |
||||||||
| Plot | Lyso | Other | |||||||||||
| Expt D |
7 peptides |
21 spectra |
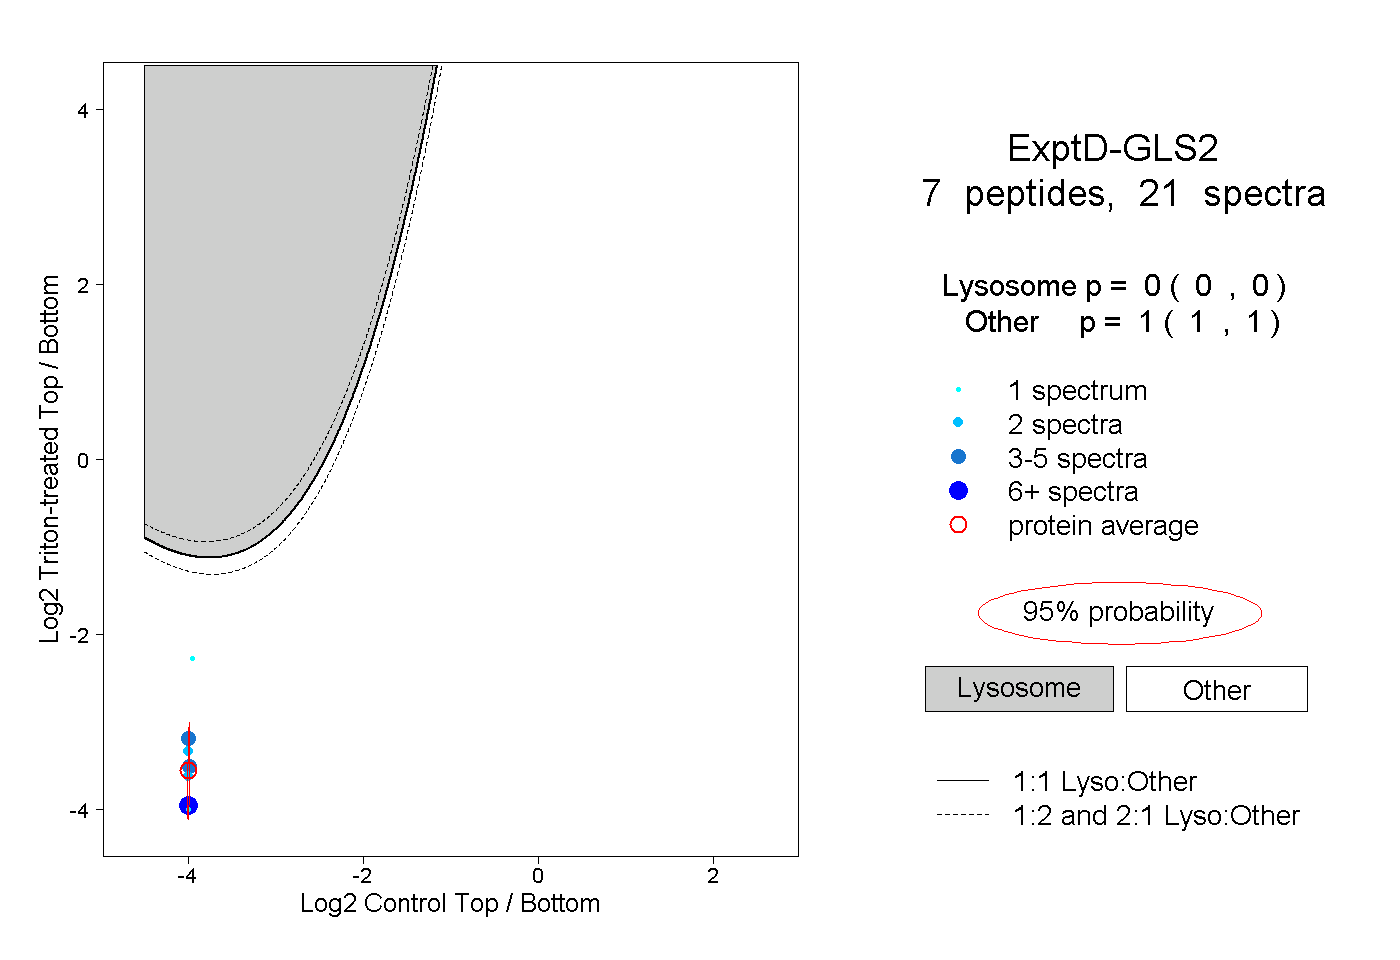 |
0.000 0.000 | 0.000 |
1.000 1.000 | 1.000 |