 3
3peptides
spectra
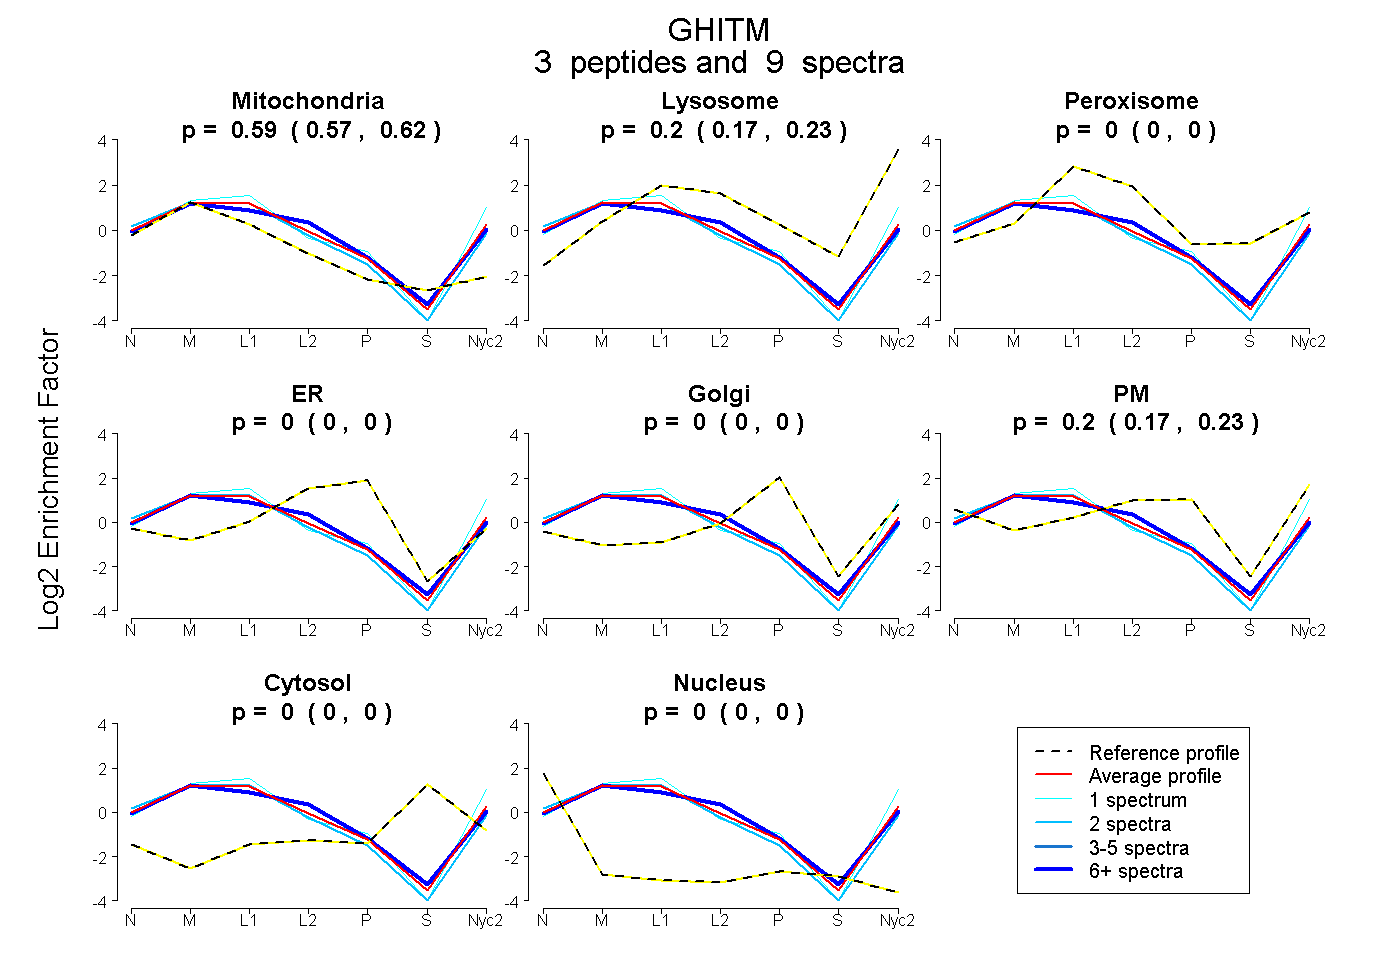
0.565 | 0.617
0.166 | 0.232
0.000 | 0.000
0.000 | 0.000
0.000 | 0.000
0.170 | 0.233
0.000 | 0.000
0.000 | 0.000
2peptides
spectra
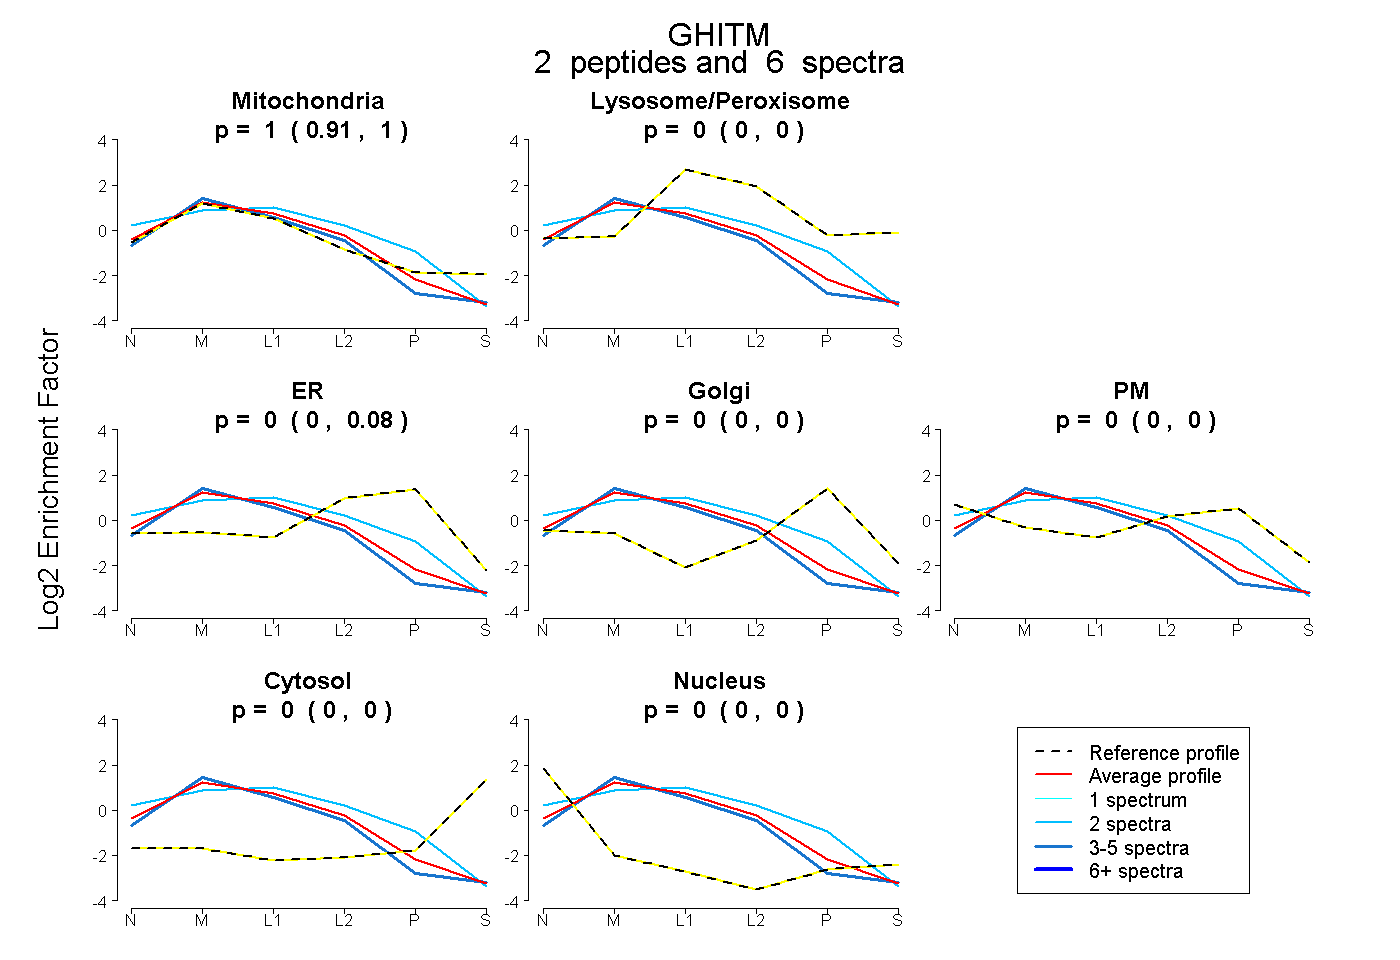
0.907 | 1.000
0.000 | 0.000
0.000 | 0.079
0.000 | 0.000
0.000 | 0.000
0.000 | 0.000
0.000 | 0.000
6peptides
spectra
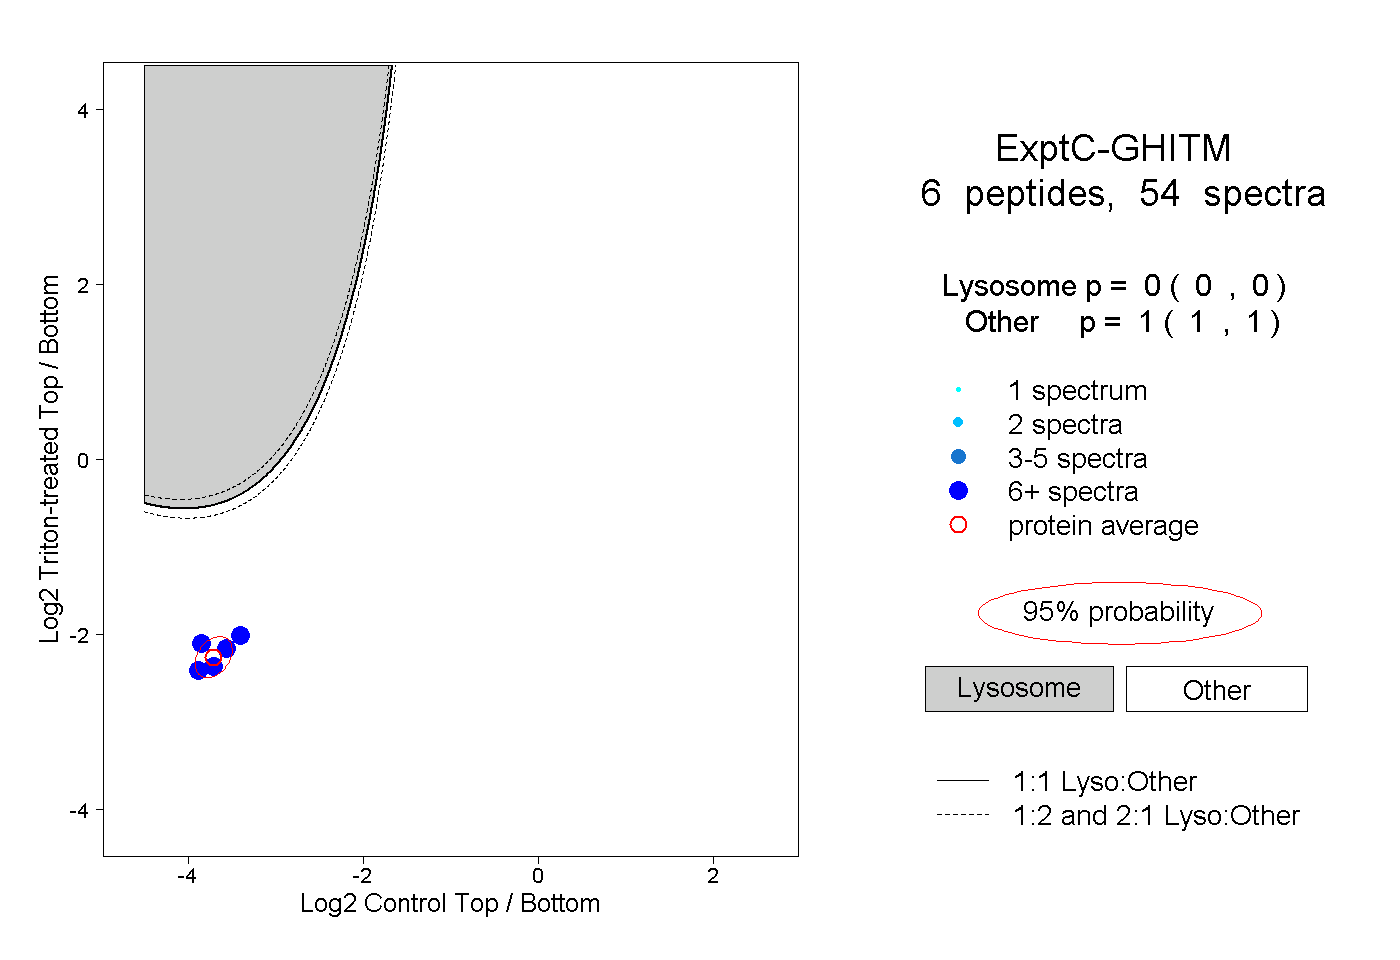
0.000 | 0.000
1.000 | 1.000
3peptides
spectra
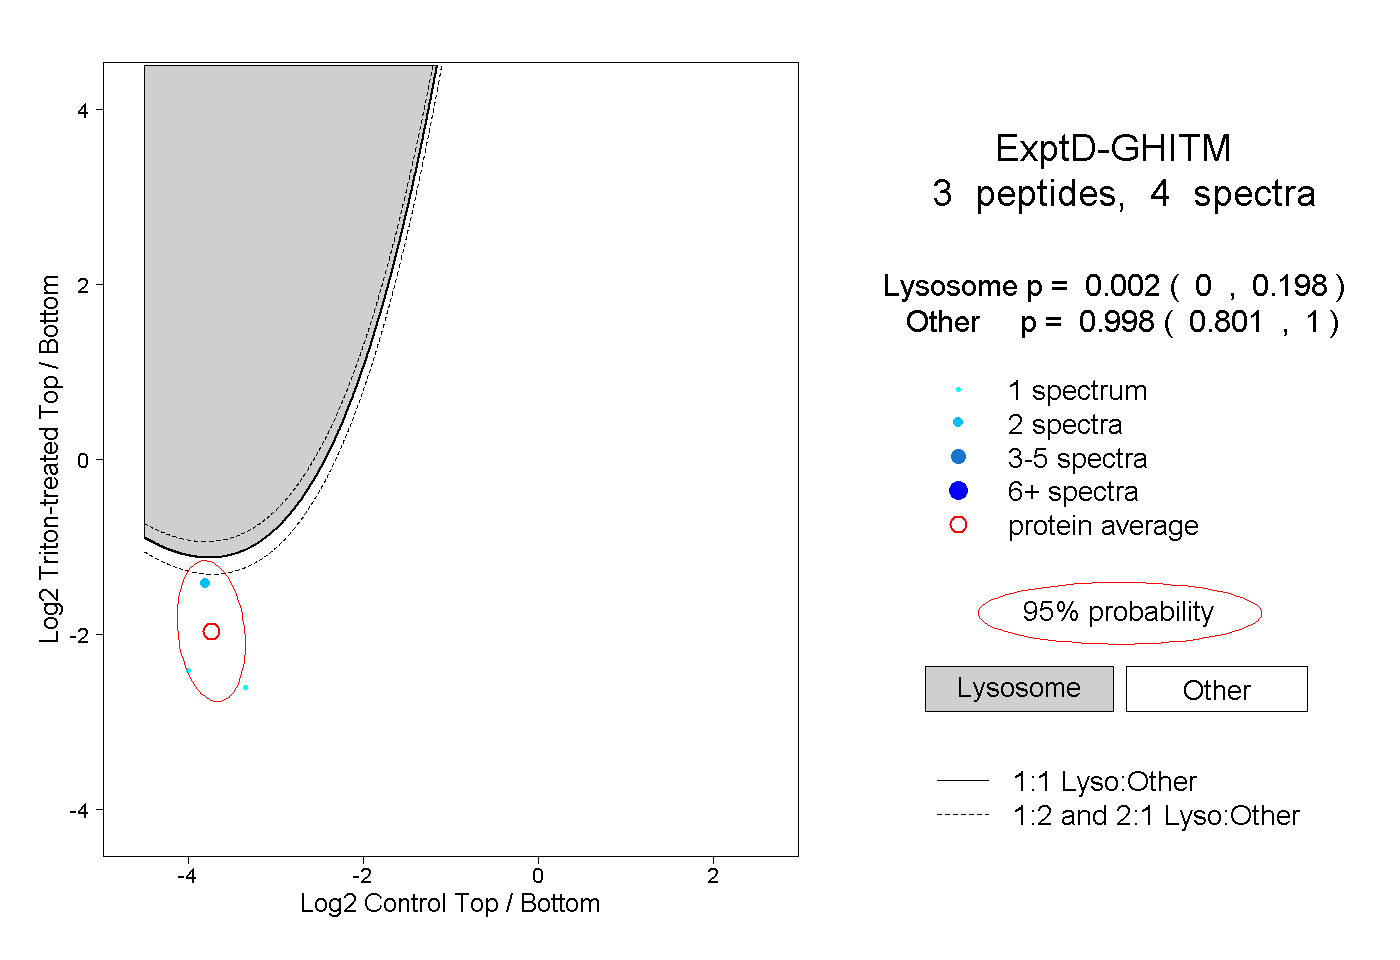
0.000 | 0.198
0.801 | 1.000