15
15peptides
spectra
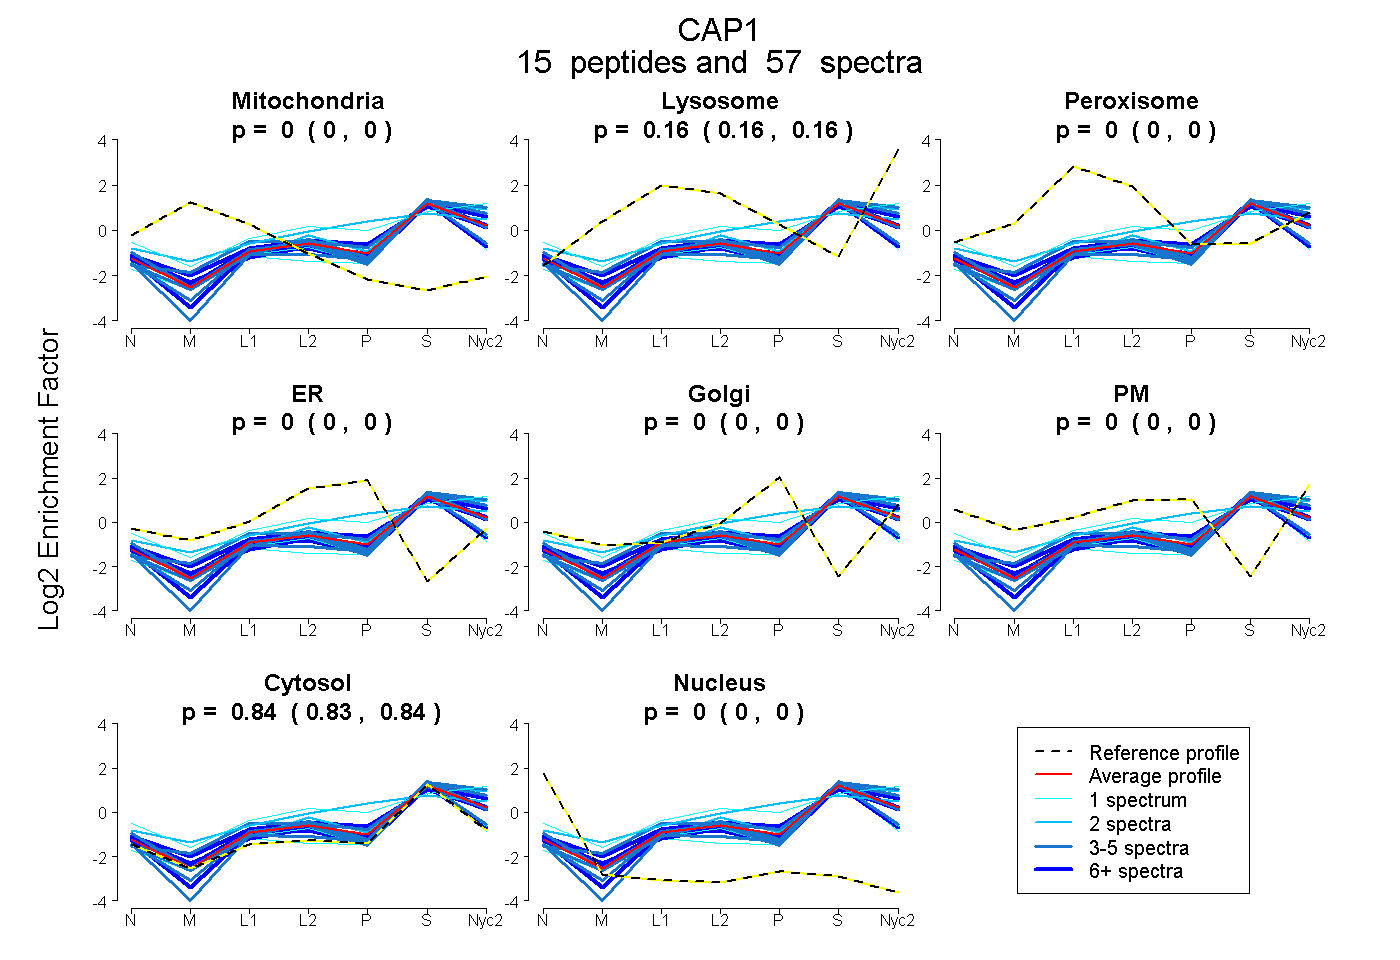
0.000 | 0.000
0.157 | 0.165
0.000 | 0.000
0.000 | 0.000
0.000 | 0.000
0.000 | 0.000
0.834 | 0.842
0.000 | 0.000
6peptides
spectra
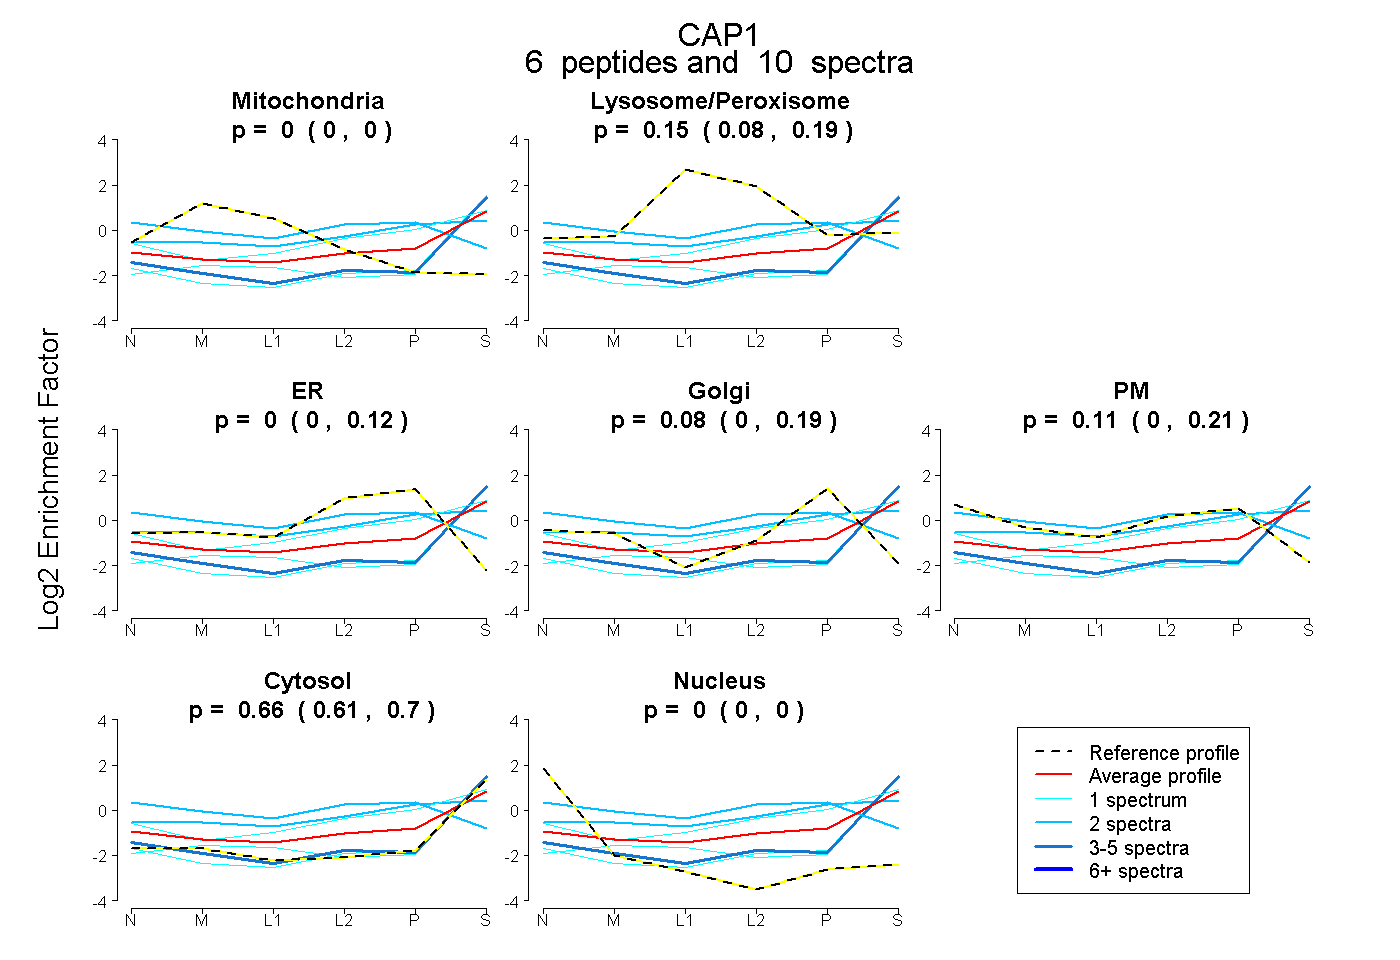
0.000 | 0.000
0.082 | 0.194
0.000 | 0.122
0.000 | 0.186
0.000 | 0.213
0.608 | 0.705
0.000 | 0.000