 15
15peptides
spectra
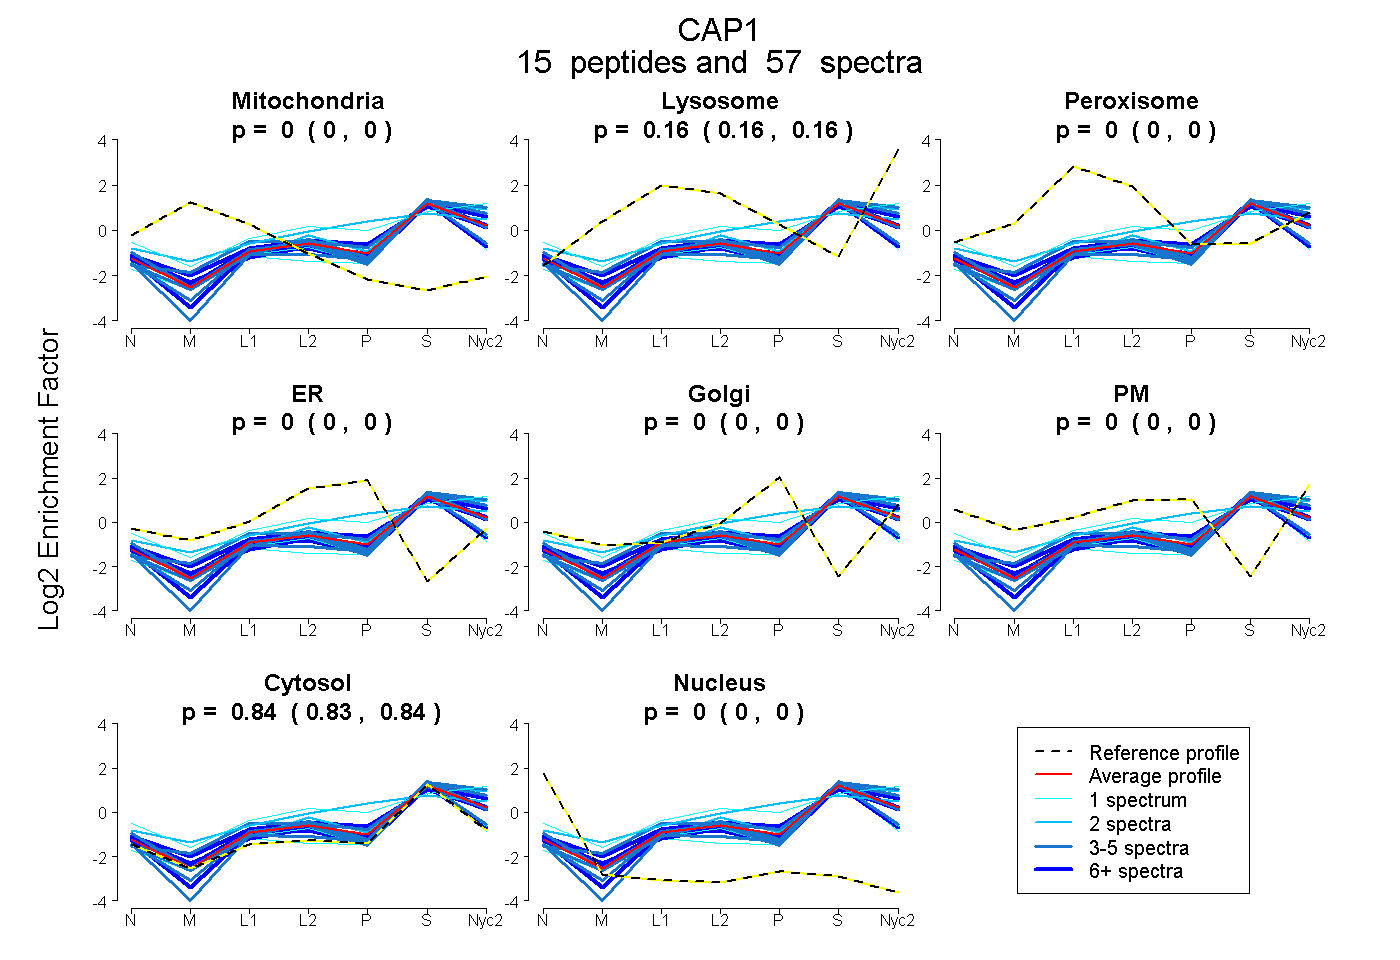
0.000 | 0.000
0.157 | 0.165
0.000 | 0.000
0.000 | 0.000
0.000 | 0.000
0.000 | 0.000
0.834 | 0.842
0.000 | 0.000
| Plot | Mito | Lyso | Perox | ER | Golgi | PM | Cytosol | Nucleus | |||||
| Expt A |
15 peptides |
57 spectra |
|
0.000 0.000 | 0.000 |
0.161 0.157 | 0.165 |
0.000 0.000 | 0.000 |
0.000 0.000 | 0.000 |
0.000 0.000 | 0.000 |
0.000 0.000 | 0.000 |
0.839 0.834 | 0.842 |
0.000 0.000 | 0.000 |
| 3 spectra, VPTISINK | 0.000 | 0.028 | 0.000 | 0.000 | 0.000 | 0.000 | 0.972 | 0.000 | ||
| 3 spectra, QVAYIYK | 0.000 | 0.179 | 0.000 | 0.000 | 0.000 | 0.000 | 0.821 | 0.000 | ||
| 7 spectra, EMNDAAMFYTNR | 0.000 | 0.181 | 0.000 | 0.000 | 0.000 | 0.000 | 0.819 | 0.000 | ||
| 6 spectra, EIGGDVQK | 0.000 | 0.171 | 0.000 | 0.000 | 0.000 | 0.064 | 0.765 | 0.000 | ||
| 1 spectrum, VQVMGK | 0.000 | 0.274 | 0.000 | 0.000 | 0.000 | 0.171 | 0.556 | 0.000 | ||
| 3 spectra, NSLDCEIVSAK | 0.000 | 0.000 | 0.202 | 0.000 | 0.000 | 0.000 | 0.798 | 0.000 | ||
| 6 spectra, CVNTTLQIK | 0.000 | 0.000 | 0.119 | 0.000 | 0.000 | 0.000 | 0.881 | 0.000 | ||
| 9 spectra, AQSGPVR | 0.000 | 0.102 | 0.000 | 0.000 | 0.000 | 0.000 | 0.898 | 0.000 | ||
| 2 spectra, HAEMVHTGLK | 0.000 | 0.237 | 0.000 | 0.000 | 0.000 | 0.000 | 0.763 | 0.000 | ||
| 1 spectrum, ALLVTASQCQQPAGNK | 0.000 | 0.000 | 0.002 | 0.000 | 0.000 | 0.000 | 0.998 | 0.000 | ||
| 2 spectra, TGPVAK | 0.000 | 0.175 | 0.062 | 0.000 | 0.229 | 0.000 | 0.533 | 0.000 | ||
| 1 spectrum, INSITVDNCK | 0.000 | 0.000 | 0.069 | 0.000 | 0.000 | 0.000 | 0.931 | 0.000 | ||
| 7 spectra, HVDWVR | 0.000 | 0.127 | 0.000 | 0.000 | 0.000 | 0.020 | 0.854 | 0.000 | ||
| 3 spectra, TLWNGQK | 0.000 | 0.190 | 0.000 | 0.000 | 0.000 | 0.000 | 0.810 | 0.000 | ||
| 3 spectra, HVSDDMK | 0.000 | 0.126 | 0.000 | 0.000 | 0.000 | 0.061 | 0.813 | 0.000 |
| Plot | Mito | Lyso or Perox | ER | Golgi | PM | Cytosol | Nucleus | ||||||
| Expt B |
6 peptides |
10 spectra |
 |
0.000 0.000 | 0.000 |
0.150 0.082 | 0.194 |
0.000 0.000 | 0.122 |
0.082 0.000 | 0.186 |
0.106 0.000 | 0.213 |
0.662 0.608 | 0.705 |
0.000 0.000 | 0.000 |
|||
| Plot | Lyso | Other | |||||||||||
| Expt C |
17 peptides |
79 spectra |
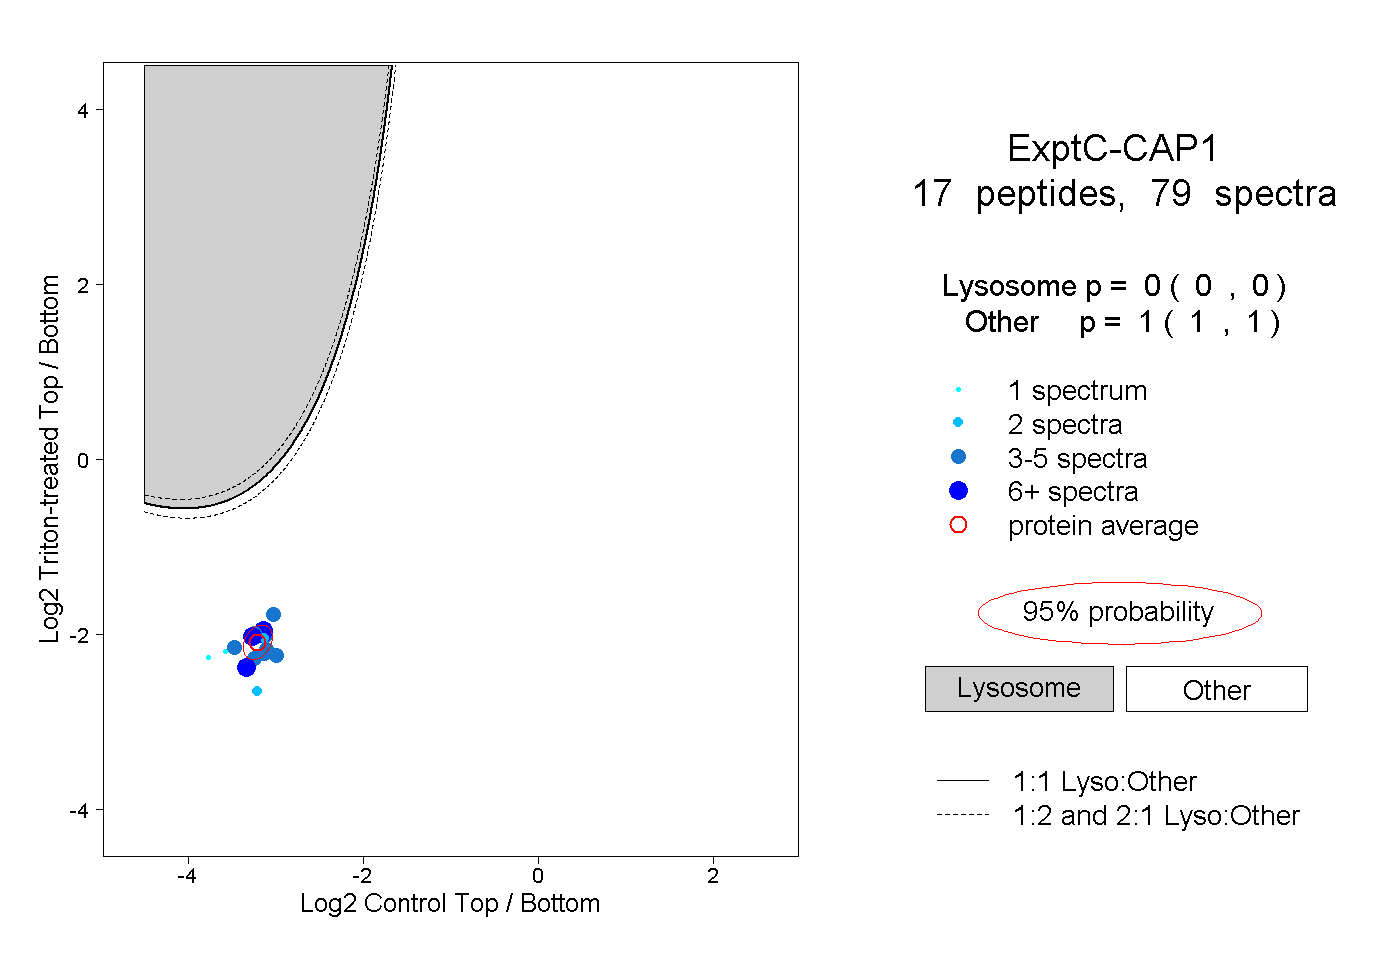 |
0.000 0.000 | 0.000 |
1.000 1.000 | 1.000 |
||||||||
| Plot | Lyso | Other | |||||||||||
| Expt D |
6 peptides |
10 spectra |
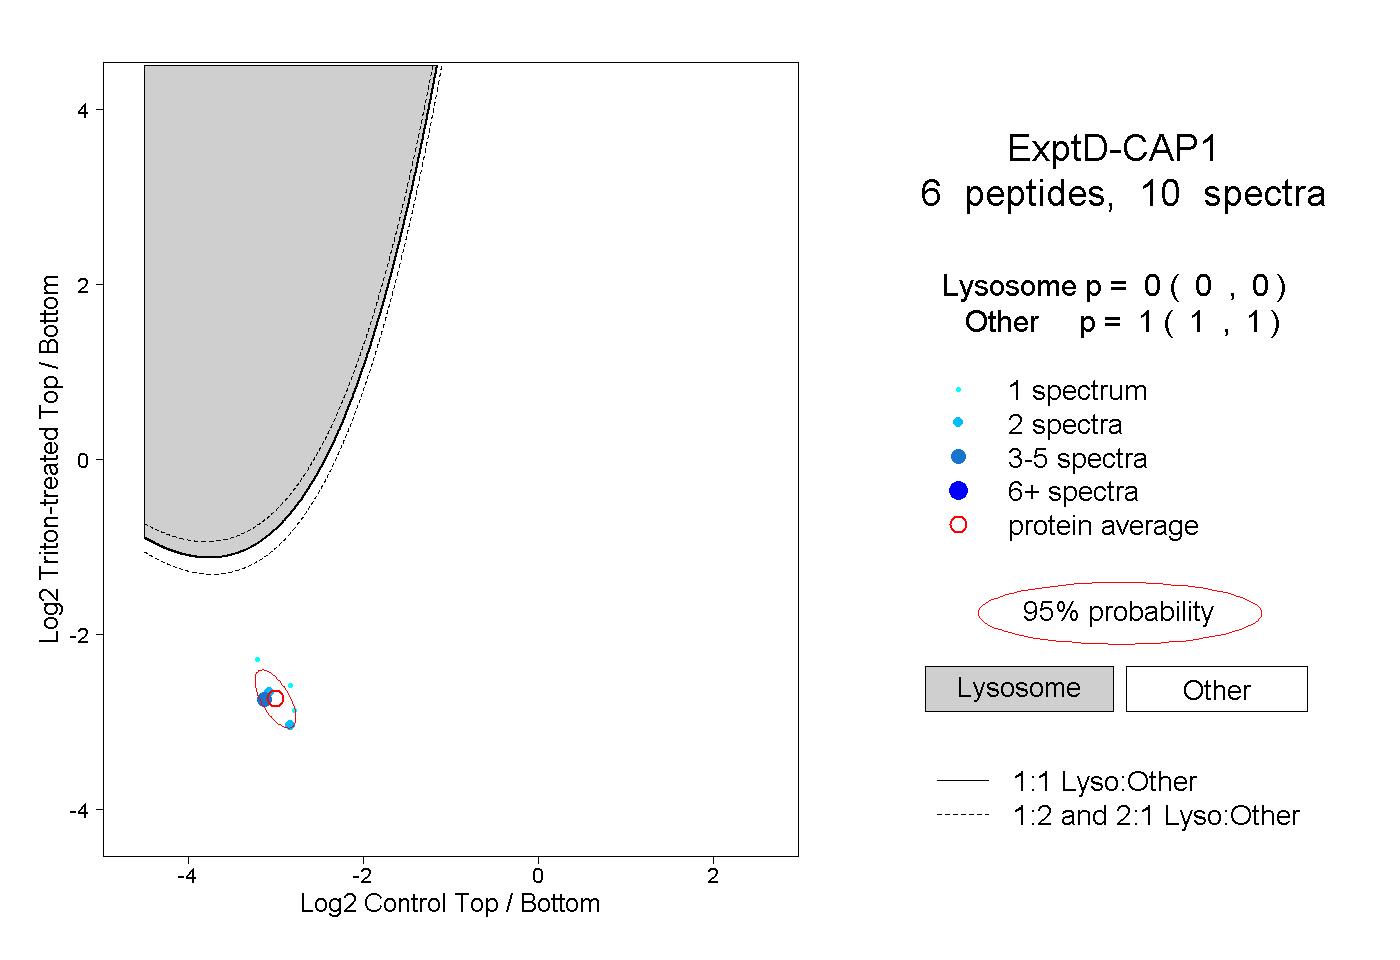 |
0.000 0.000 | 0.000 |
1.000 1.000 | 1.000 |