 6
6peptides
spectra
0.000 | 0.000
0.000 | 0.000
0.000 | 0.000
0.000 | 0.054
0.014 | 0.121
0.000 | 0.000
0.496 | 0.529
0.355 | 0.419
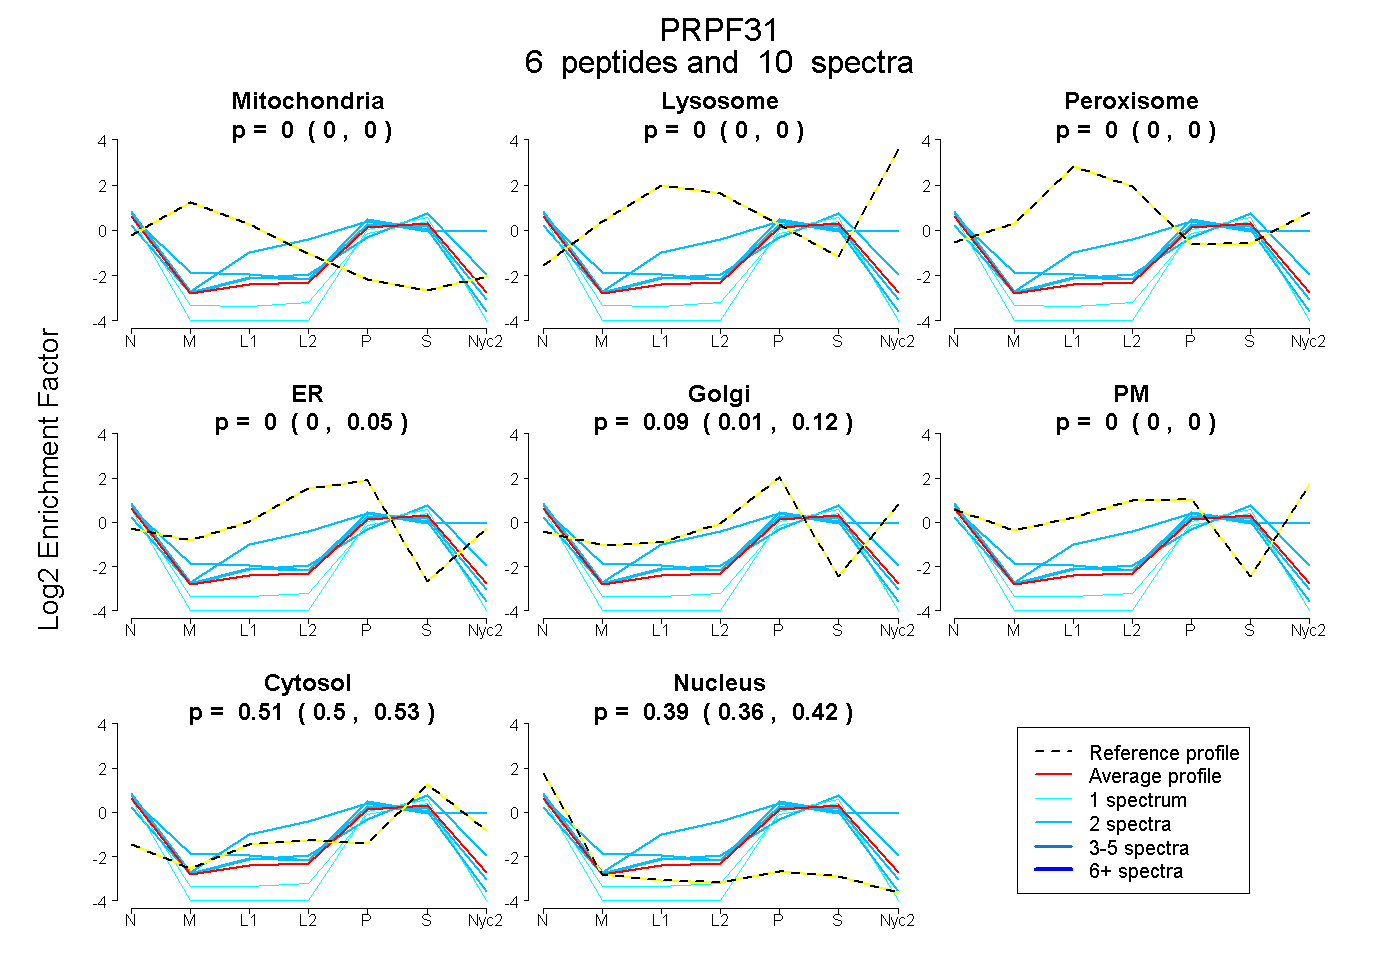
| Plot | Mito | Lyso | Perox | ER | Golgi | PM | Cytosol | Nucleus | |||||
| Expt A |
6 peptides |
10 spectra |
|
0.000 0.000 | 0.000 |
0.000 0.000 | 0.000 |
0.000 0.000 | 0.000 |
0.000 0.000 | 0.054 |
0.095 0.014 | 0.121 |
0.000 0.000 | 0.000 |
0.514 0.496 | 0.529 |
0.391 0.355 | 0.419 |
| 2 spectra, QVKPLPAPLDGQR | 0.000 | 0.000 | 0.000 | 0.146 | 0.012 | 0.000 | 0.458 | 0.385 | ||
| 2 spectra, IMGVAGGLTNLSK | 0.000 | 0.000 | 0.000 | 0.000 | 0.066 | 0.000 | 0.674 | 0.260 | ||
| 2 spectra, YFSSMAEFLK | 0.000 | 0.000 | 0.000 | 0.129 | 0.000 | 0.000 | 0.423 | 0.448 | ||
| 1 spectrum, IEEYISK | 0.000 | 0.000 | 0.000 | 0.000 | 0.000 | 0.000 | 0.429 | 0.571 | ||
| 1 spectrum, MPACNIMLLGAQR | 0.000 | 0.000 | 0.000 | 0.000 | 0.000 | 0.000 | 0.395 | 0.605 | ||
| 2 spectra, IYEYVESR | 0.000 | 0.000 | 0.000 | 0.000 | 0.114 | 0.320 | 0.474 | 0.091 |
| Plot | Mito | Lyso or Perox | ER | Golgi | PM | Cytosol | Nucleus | ||||||
| Expt B |
1 peptide |
2 spectra |
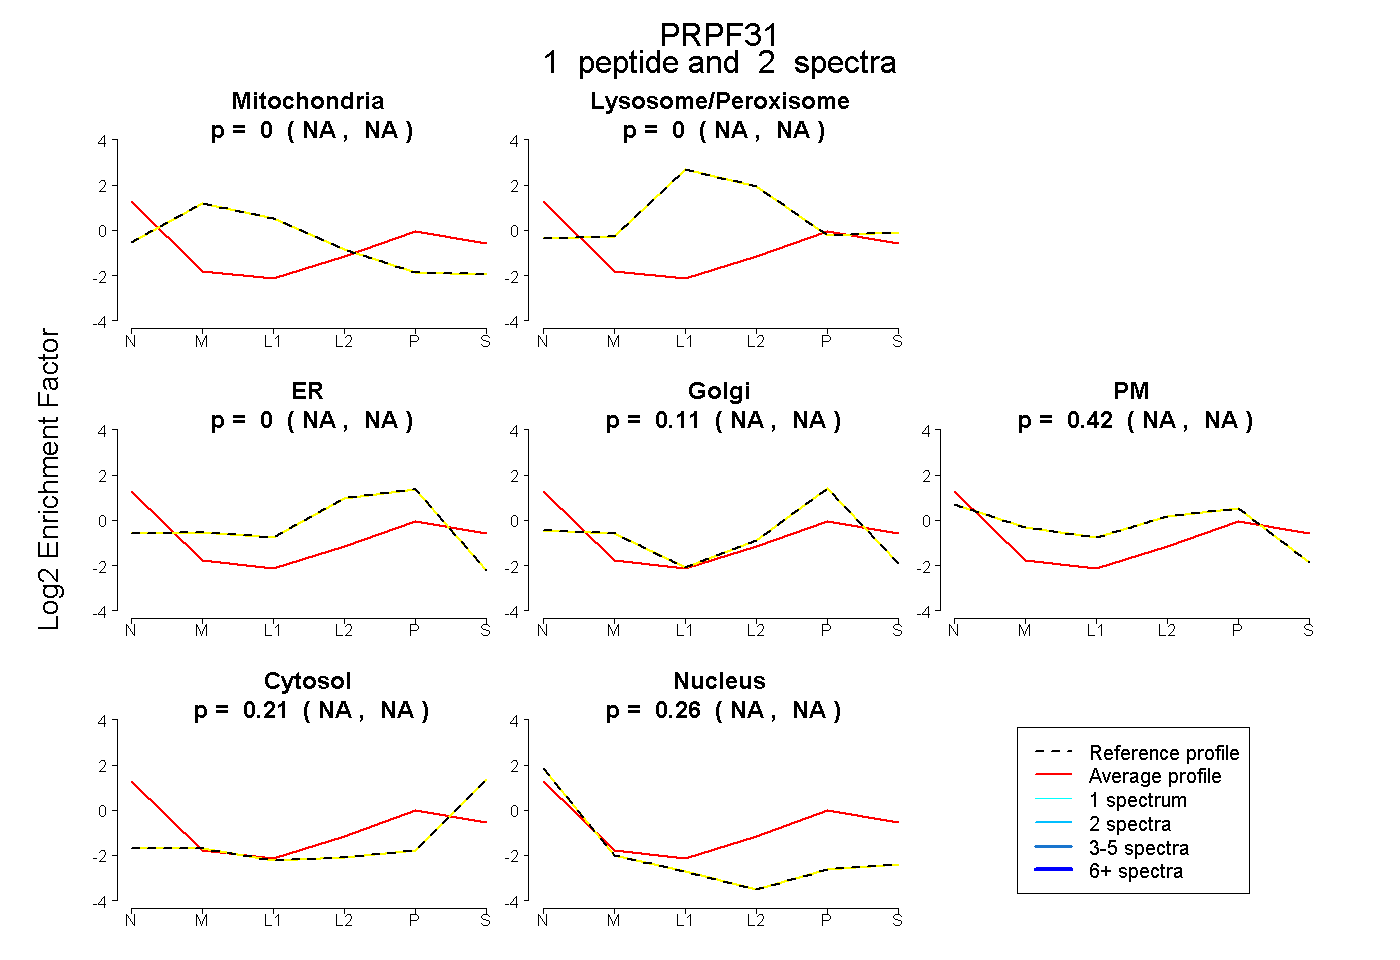 |
0.000 NA | NA |
0.000 NA | NA |
0.000 NA | NA |
0.113 NA | NA |
0.421 NA | NA |
0.210 NA | NA |
0.256 NA | NA |
|||
| Plot | Lyso | Other | |||||||||||
| Expt C |
2 peptides |
3 spectra |
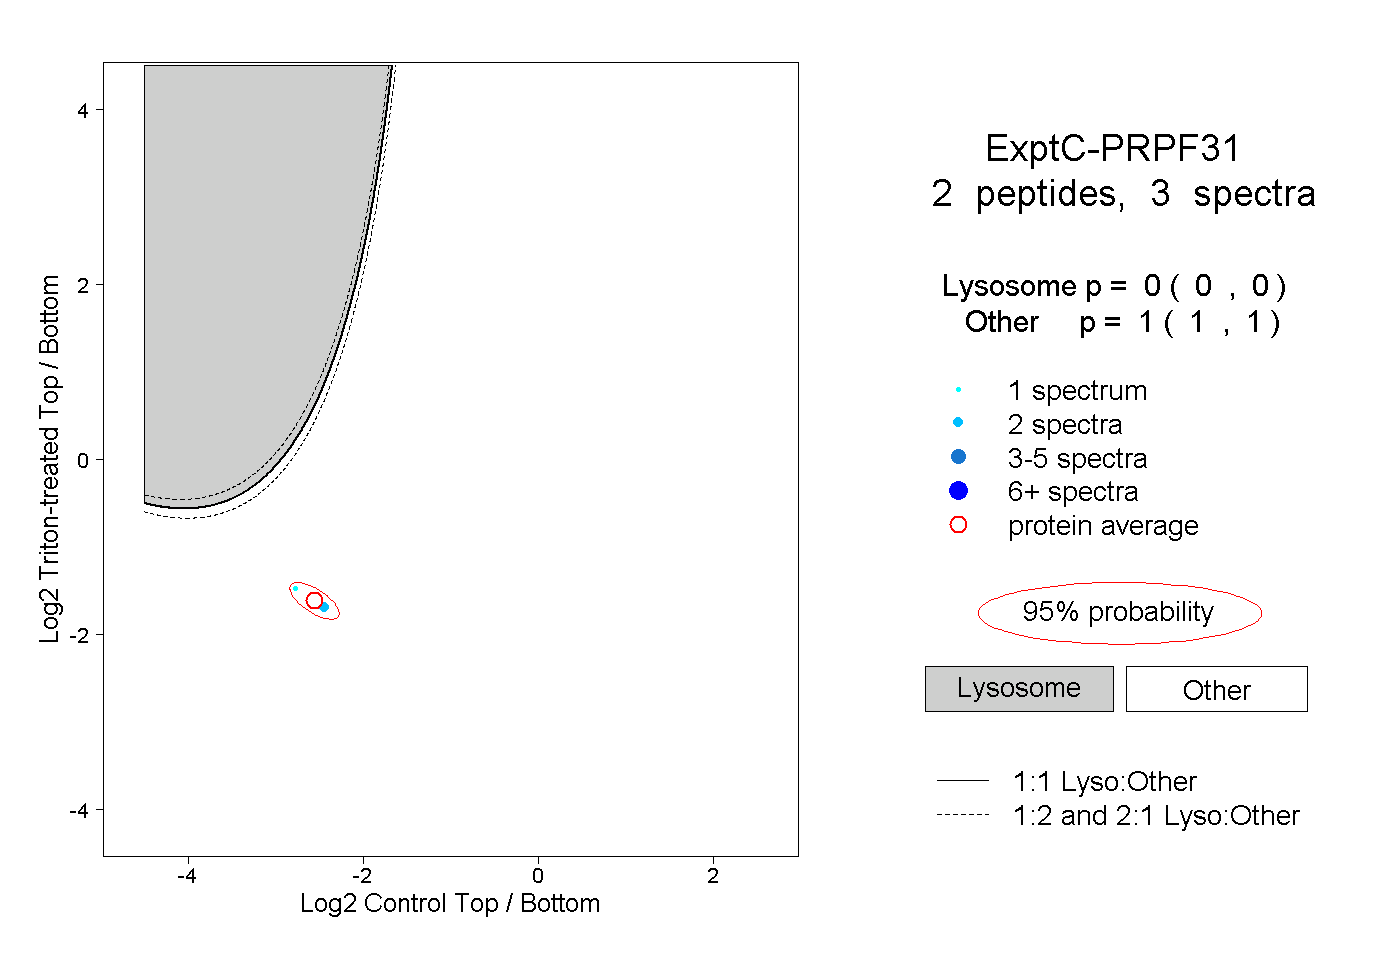 |
0.000 0.000 | 0.000 |
1.000 1.000 | 1.000 |