 1
1peptide
spectra
0.079 | 0.140
0.000 | 0.000
0.000 | 0.061
0.232 | 0.343
0.000 | 0.063
0.000 | 0.028
0.290 | 0.330
0.203 | 0.242
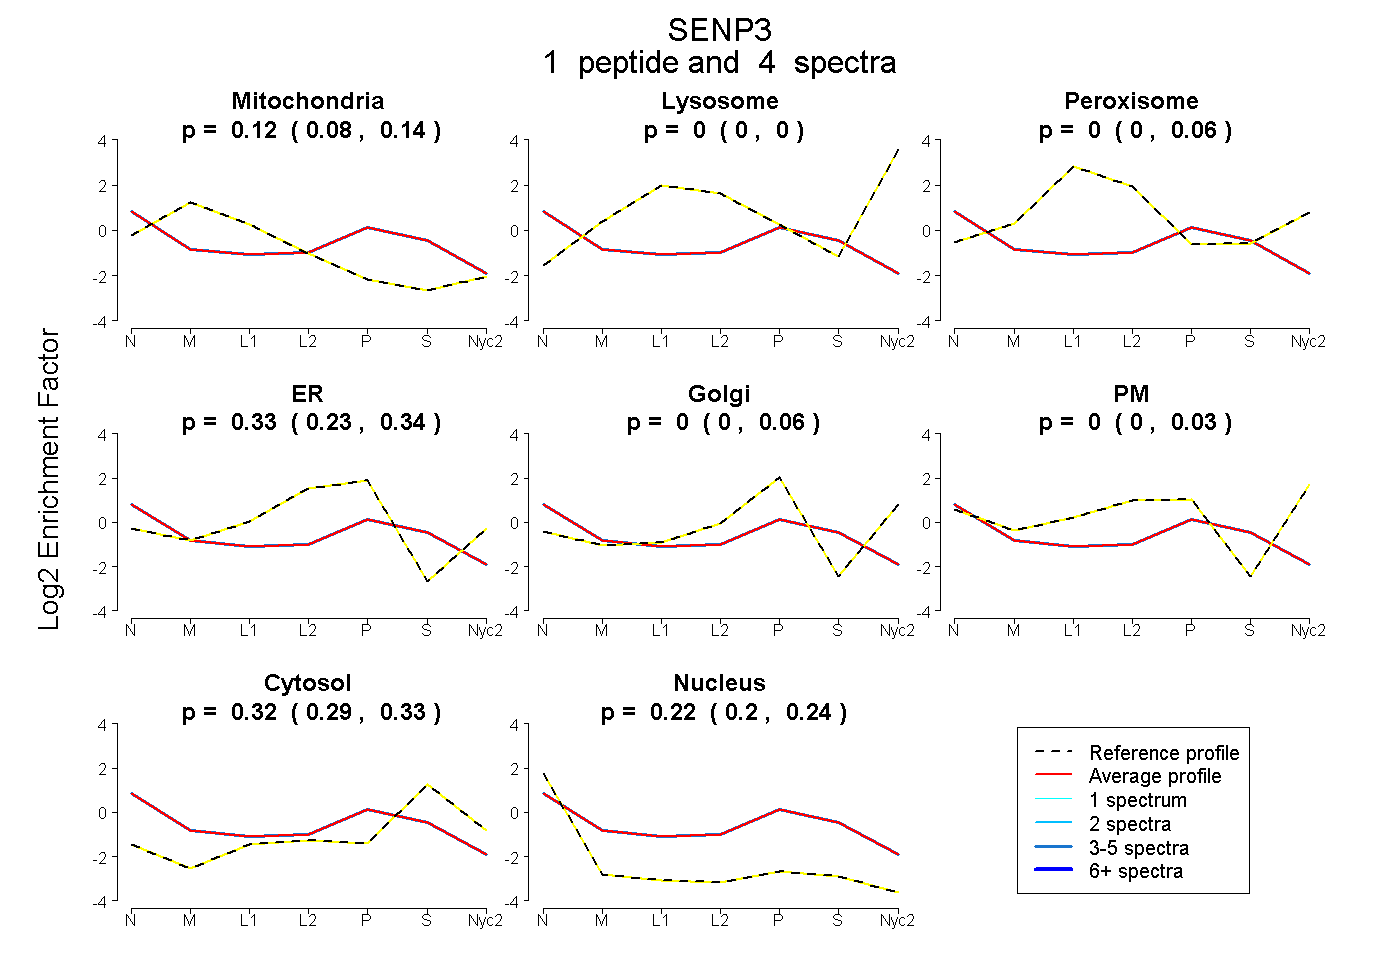
| Plot | Mito | Lyso | Perox | ER | Golgi | PM | Cytosol | Nucleus | |||||
| Expt A |
1 peptide |
4 spectra |
|
0.122 0.079 | 0.140 |
0.000 0.000 | 0.000 |
0.005 0.000 | 0.061 |
0.332 0.232 | 0.343 |
0.000 0.000 | 0.063 |
0.000 0.000 | 0.028 |
0.323 0.290 | 0.330 |
0.218 0.203 | 0.242 |