24
24peptides
spectra
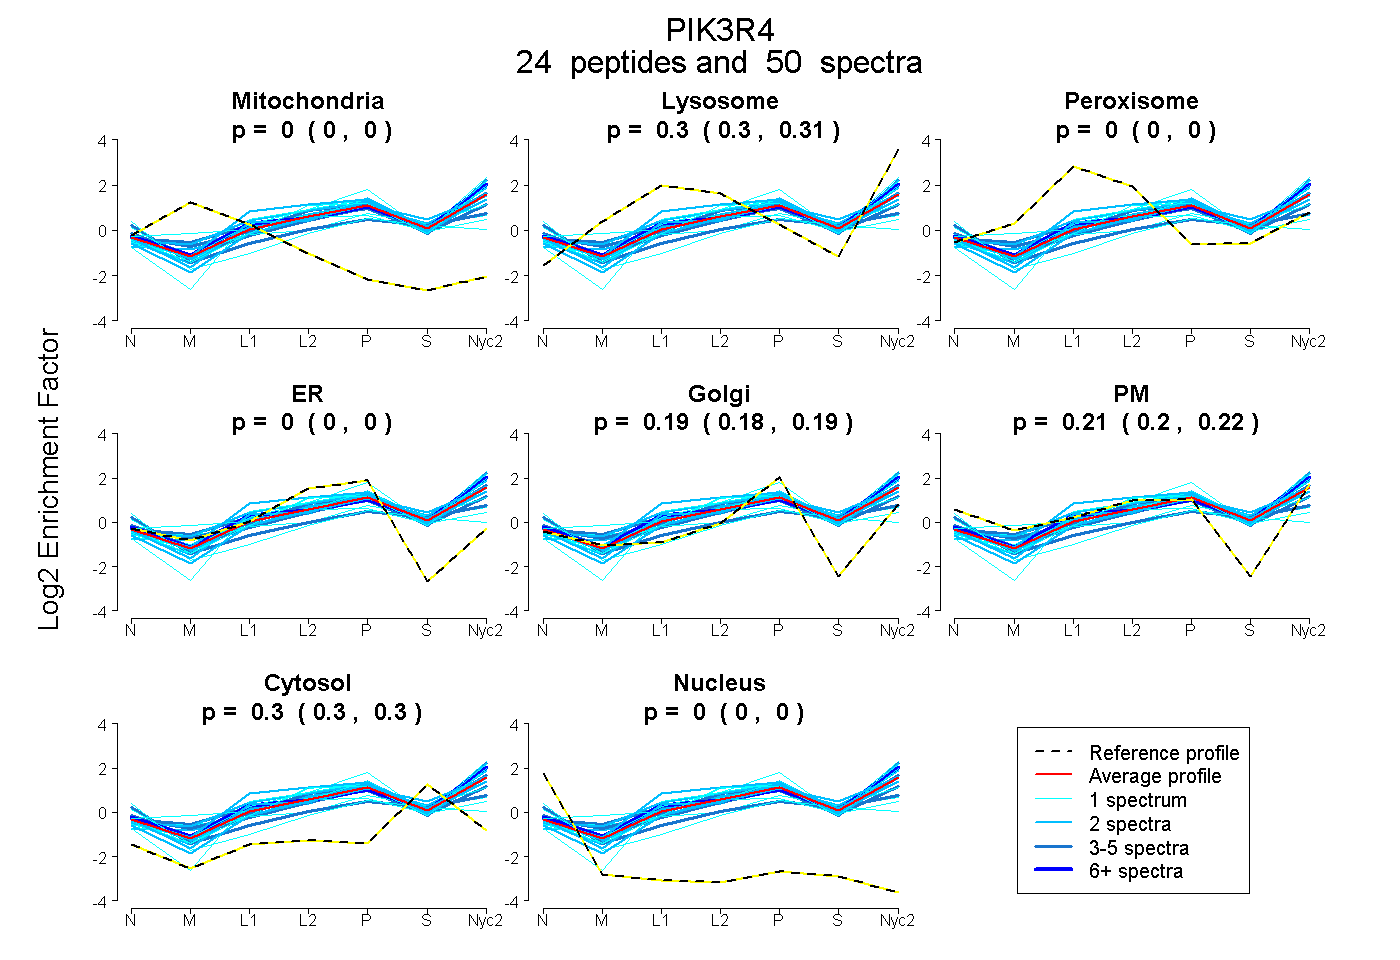
0.000 | 0.000
0.298 | 0.308
0.000 | 0.000
0.000 | 0.000
0.178 | 0.194
0.201 | 0.220
0.296 | 0.301
0.000 | 0.000
10peptides
spectra
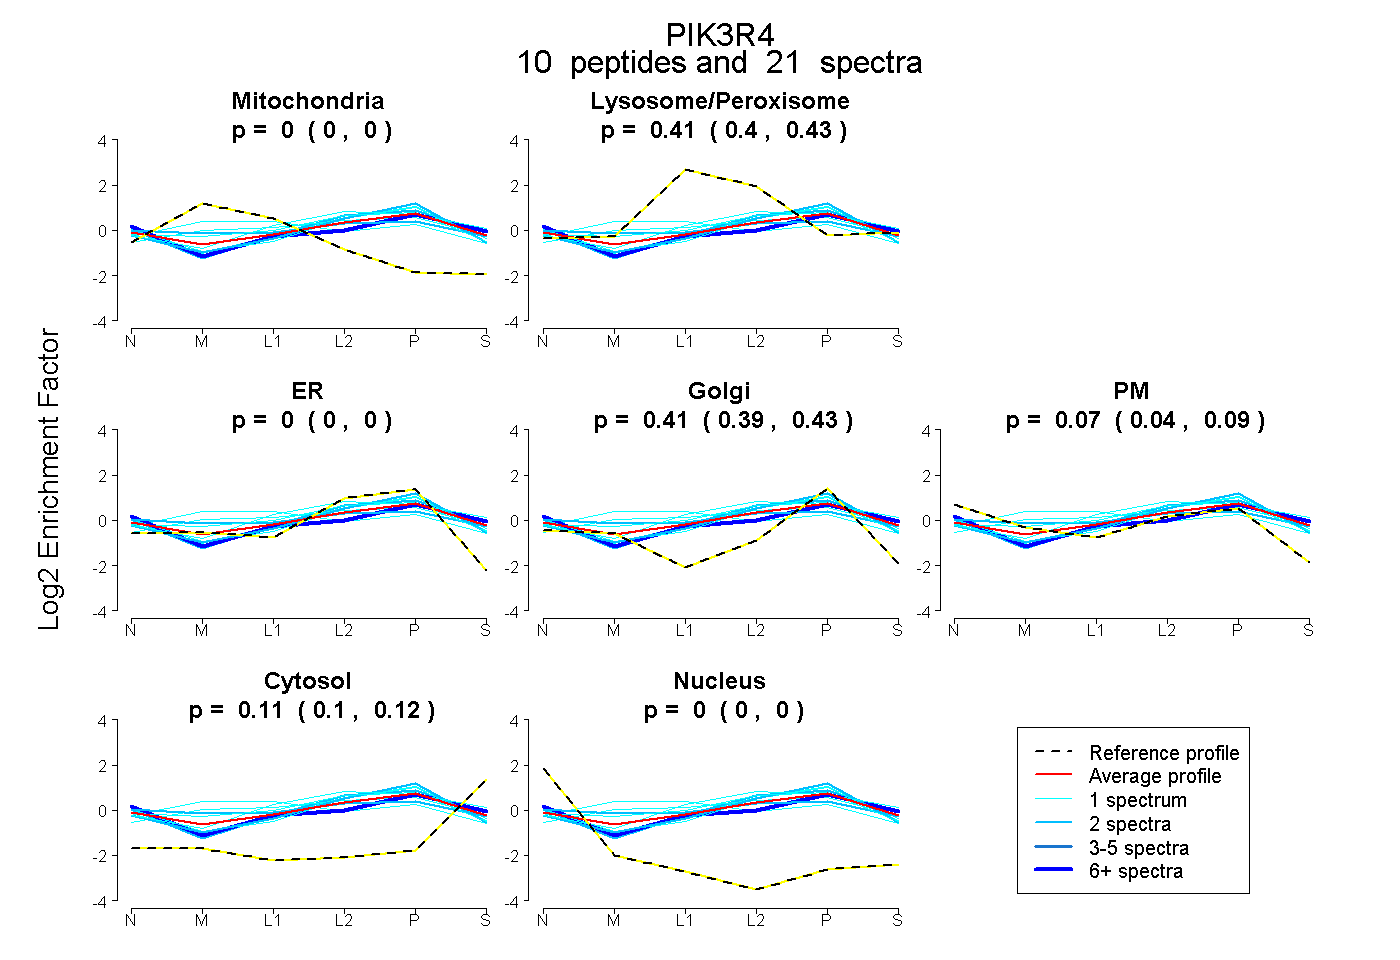
0.000 | 0.000
0.402 | 0.426
0.000 | 0.000
0.387 | 0.431
0.038 | 0.089
0.099 | 0.116
0.000 | 0.000