 24
24peptides
spectra
0.000 | 0.000
0.298 | 0.308
0.000 | 0.000
0.000 | 0.000
0.178 | 0.194
0.201 | 0.220
0.296 | 0.301
0.000 | 0.000
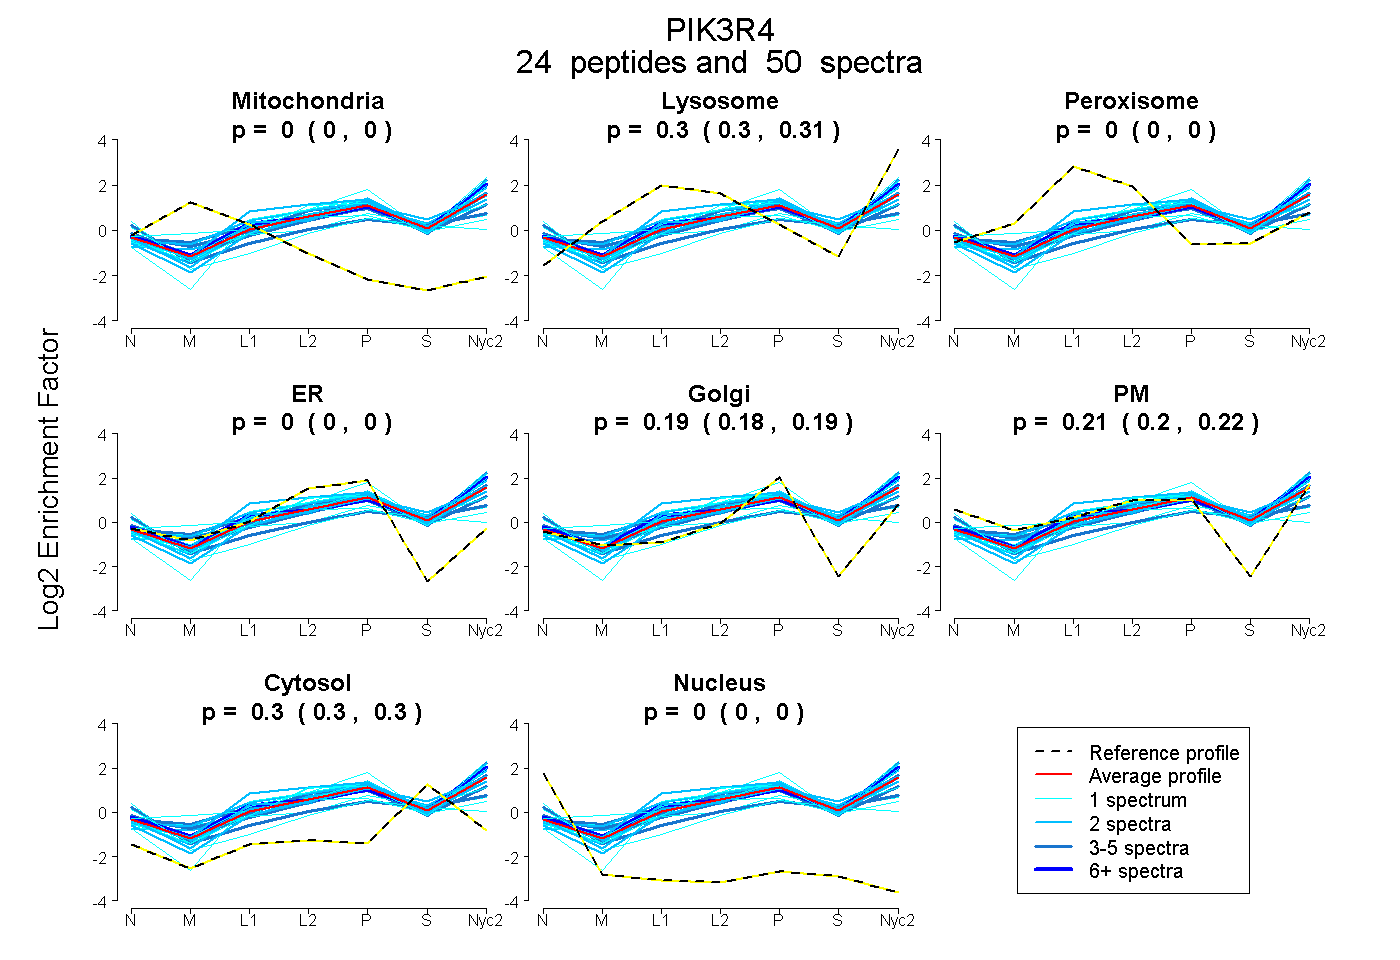
| Plot | Mito | Lyso | Perox | ER | Golgi | PM | Cytosol | Nucleus | |||||
| Expt A |
24 peptides |
50 spectra |
|
0.000 0.000 | 0.000 |
0.303 0.298 | 0.308 |
0.000 0.000 | 0.000 |
0.000 0.000 | 0.000 |
0.186 0.178 | 0.194 |
0.211 0.201 | 0.220 |
0.299 0.296 | 0.301 |
0.000 0.000 | 0.000 |
| 1 spectrum, LVLLR | 0.000 | 0.000 | 0.000 | 0.060 | 0.084 | 0.331 | 0.526 | 0.000 | ||
| 1 spectrum, GLLVAHLHEHK | 0.000 | 0.114 | 0.180 | 0.000 | 0.320 | 0.037 | 0.349 | 0.000 | ||
| 1 spectrum, FLELVQLK | 0.000 | 0.443 | 0.000 | 0.000 | 0.287 | 0.064 | 0.207 | 0.000 | ||
| 2 spectra, DIASLFR | 0.000 | 0.407 | 0.000 | 0.000 | 0.281 | 0.000 | 0.311 | 0.000 | ||
| 2 spectra, DNLYDR | 0.000 | 0.355 | 0.020 | 0.000 | 0.246 | 0.082 | 0.297 | 0.000 | ||
| 2 spectra, SIFDYALR | 0.000 | 0.312 | 0.000 | 0.000 | 0.287 | 0.132 | 0.270 | 0.000 | ||
| 1 spectrum, VLALVQEVPR | 0.000 | 0.216 | 0.000 | 0.000 | 0.040 | 0.496 | 0.248 | 0.000 | ||
| 1 spectrum, QTLMENGITR | 0.000 | 0.458 | 0.000 | 0.000 | 0.284 | 0.042 | 0.216 | 0.000 | ||
| 1 spectrum, QDSNVNEEWK | 0.000 | 0.308 | 0.000 | 0.161 | 0.268 | 0.000 | 0.263 | 0.000 | ||
| 3 spectra, ELVTQMIQR | 0.000 | 0.238 | 0.000 | 0.000 | 0.142 | 0.307 | 0.314 | 0.000 | ||
| 1 spectrum, IIEGTEVVQEIQNK | 0.000 | 0.270 | 0.129 | 0.060 | 0.246 | 0.000 | 0.294 | 0.000 | ||
| 2 spectra, AAMLFR | 0.000 | 0.352 | 0.000 | 0.000 | 0.357 | 0.018 | 0.272 | 0.000 | ||
| 4 spectra, ILVIR | 0.000 | 0.000 | 0.000 | 0.000 | 0.000 | 0.530 | 0.470 | 0.000 | ||
| 1 spectrum, LSVEILLDR | 0.000 | 0.374 | 0.000 | 0.000 | 0.334 | 0.039 | 0.253 | 0.000 | ||
| 2 spectra, VFAIQDPTLPLTSYK | 0.000 | 0.335 | 0.000 | 0.000 | 0.287 | 0.004 | 0.375 | 0.000 | ||
| 1 spectrum, LHSAQNCLPFQK | 0.000 | 0.000 | 0.353 | 0.000 | 0.289 | 0.108 | 0.250 | 0.000 | ||
| 3 spectra, ISTRPFLNNIEK | 0.000 | 0.375 | 0.000 | 0.000 | 0.172 | 0.250 | 0.203 | 0.000 | ||
| 2 spectra, IHPLQSR | 0.000 | 0.255 | 0.000 | 0.067 | 0.111 | 0.264 | 0.303 | 0.000 | ||
| 2 spectra, VGPSDDTPR | 0.000 | 0.352 | 0.110 | 0.158 | 0.130 | 0.063 | 0.188 | 0.000 | ||
| 2 spectra, IWNSQK | 0.000 | 0.471 | 0.000 | 0.000 | 0.197 | 0.151 | 0.181 | 0.000 | ||
| 8 spectra, LEADDYLK | 0.000 | 0.370 | 0.000 | 0.000 | 0.114 | 0.238 | 0.278 | 0.000 | ||
| 2 spectra, ETFLSADER | 0.000 | 0.334 | 0.000 | 0.000 | 0.203 | 0.187 | 0.276 | 0.000 | ||
| 2 spectra, SILTYSR | 0.000 | 0.327 | 0.000 | 0.000 | 0.253 | 0.114 | 0.306 | 0.000 | ||
| 3 spectra, DLGNIIHNLCGHDLPEK | 0.000 | 0.193 | 0.178 | 0.000 | 0.284 | 0.111 | 0.233 | 0.000 |
| Plot | Mito | Lyso or Perox | ER | Golgi | PM | Cytosol | Nucleus | ||||||
| Expt B |
10 peptides |
21 spectra |
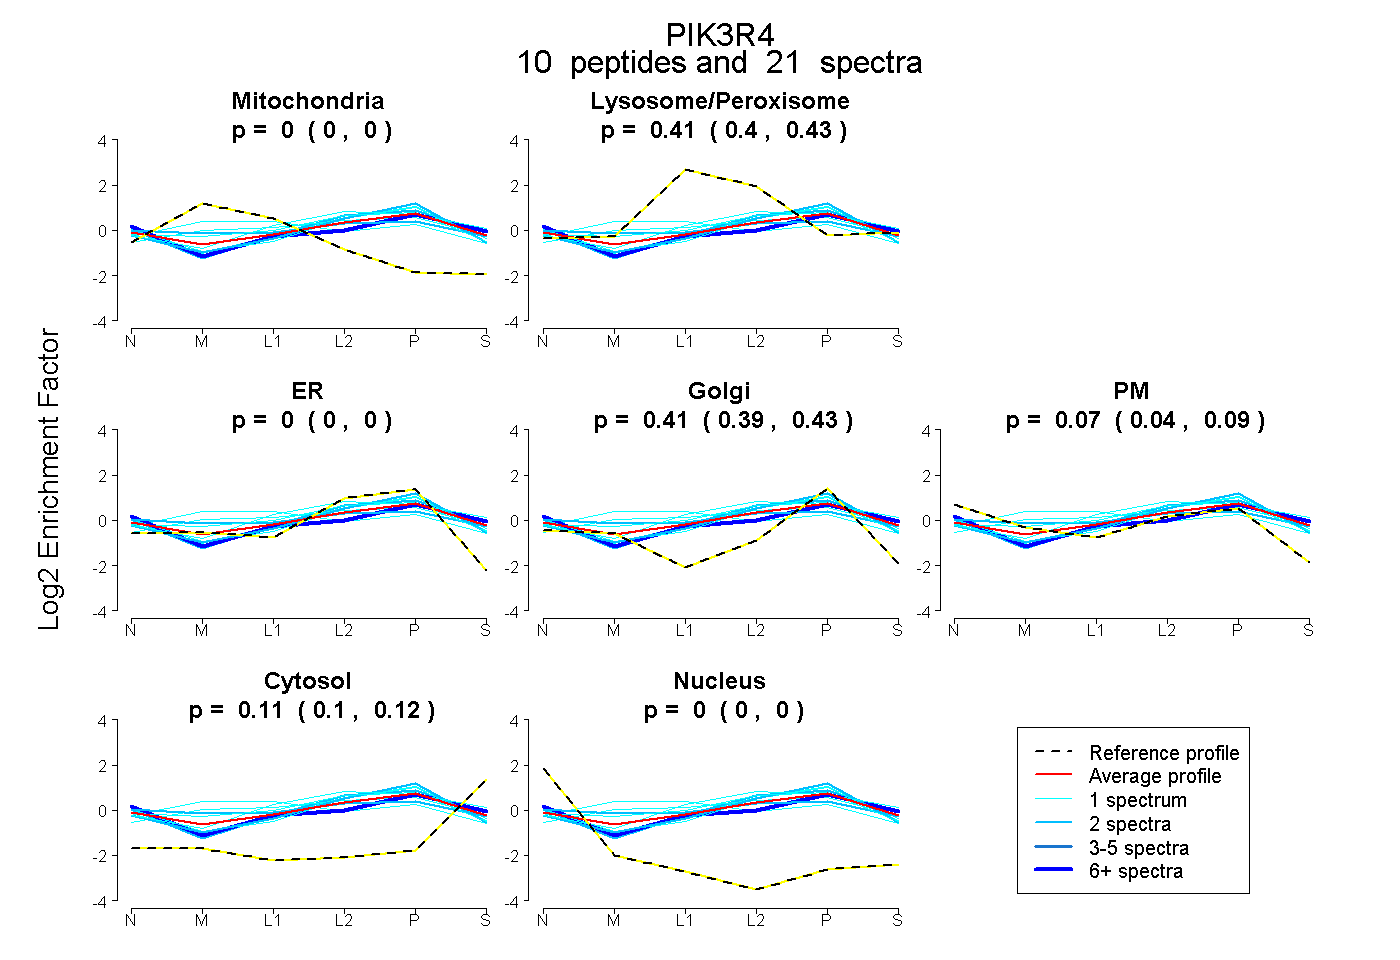 |
0.000 0.000 | 0.000 |
0.414 0.402 | 0.426 |
0.000 0.000 | 0.000 |
0.412 0.387 | 0.431 |
0.065 0.038 | 0.089 |
0.109 0.099 | 0.116 |
0.000 0.000 | 0.000 |
|||
| Plot | Lyso | Other | |||||||||||
| Expt C |
27 peptides |
90 spectra |
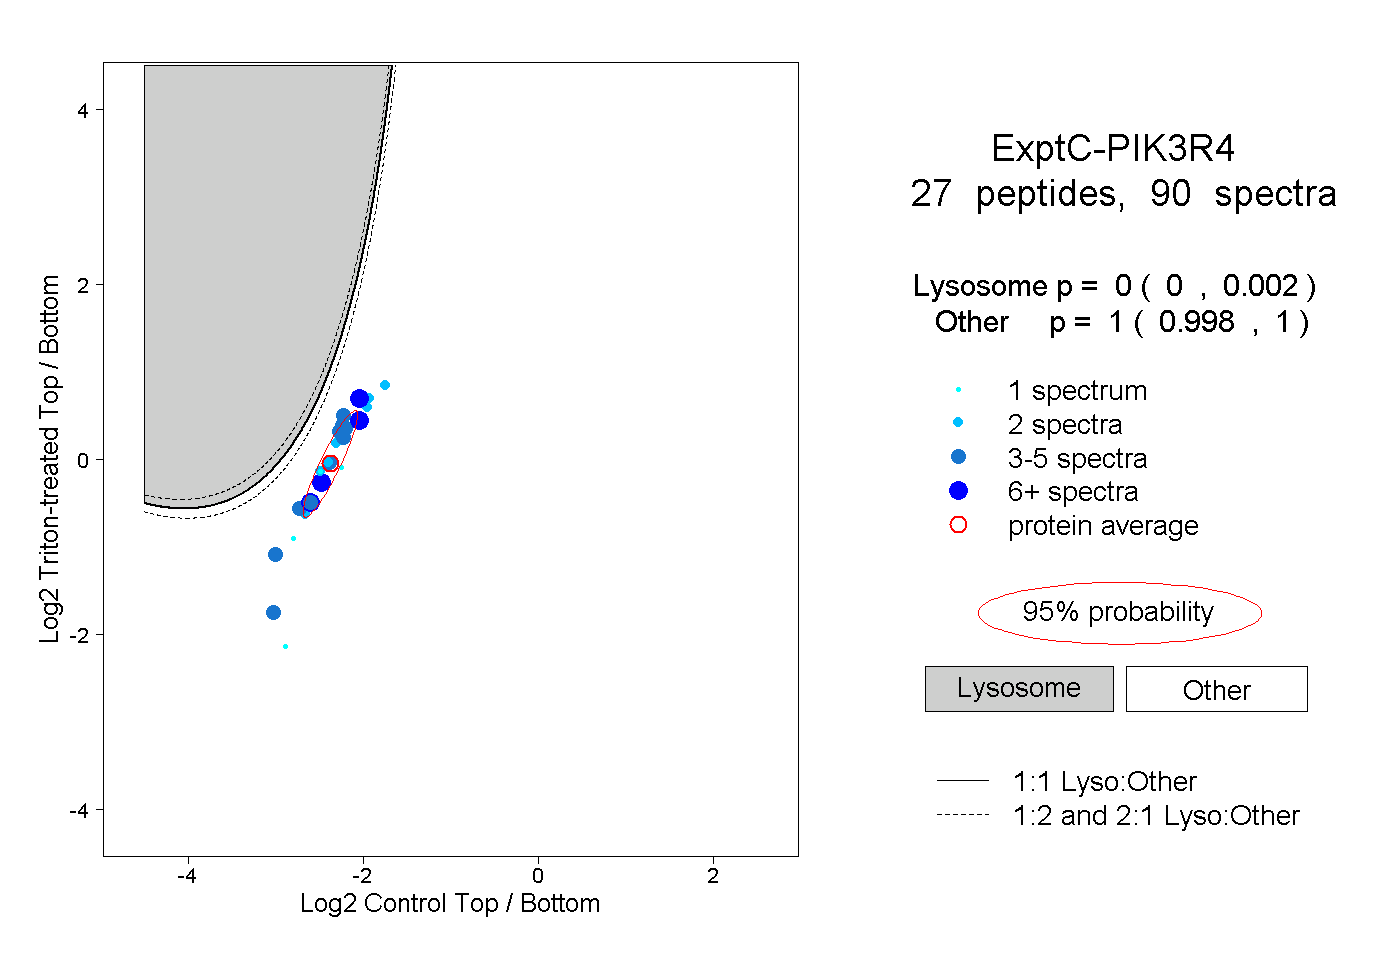 |
0.000 0.000 | 0.002 |
1.000 0.998 | 1.000 |
||||||||
| Plot | Lyso | Other | |||||||||||
| Expt D |
1 peptide |
5 spectra |
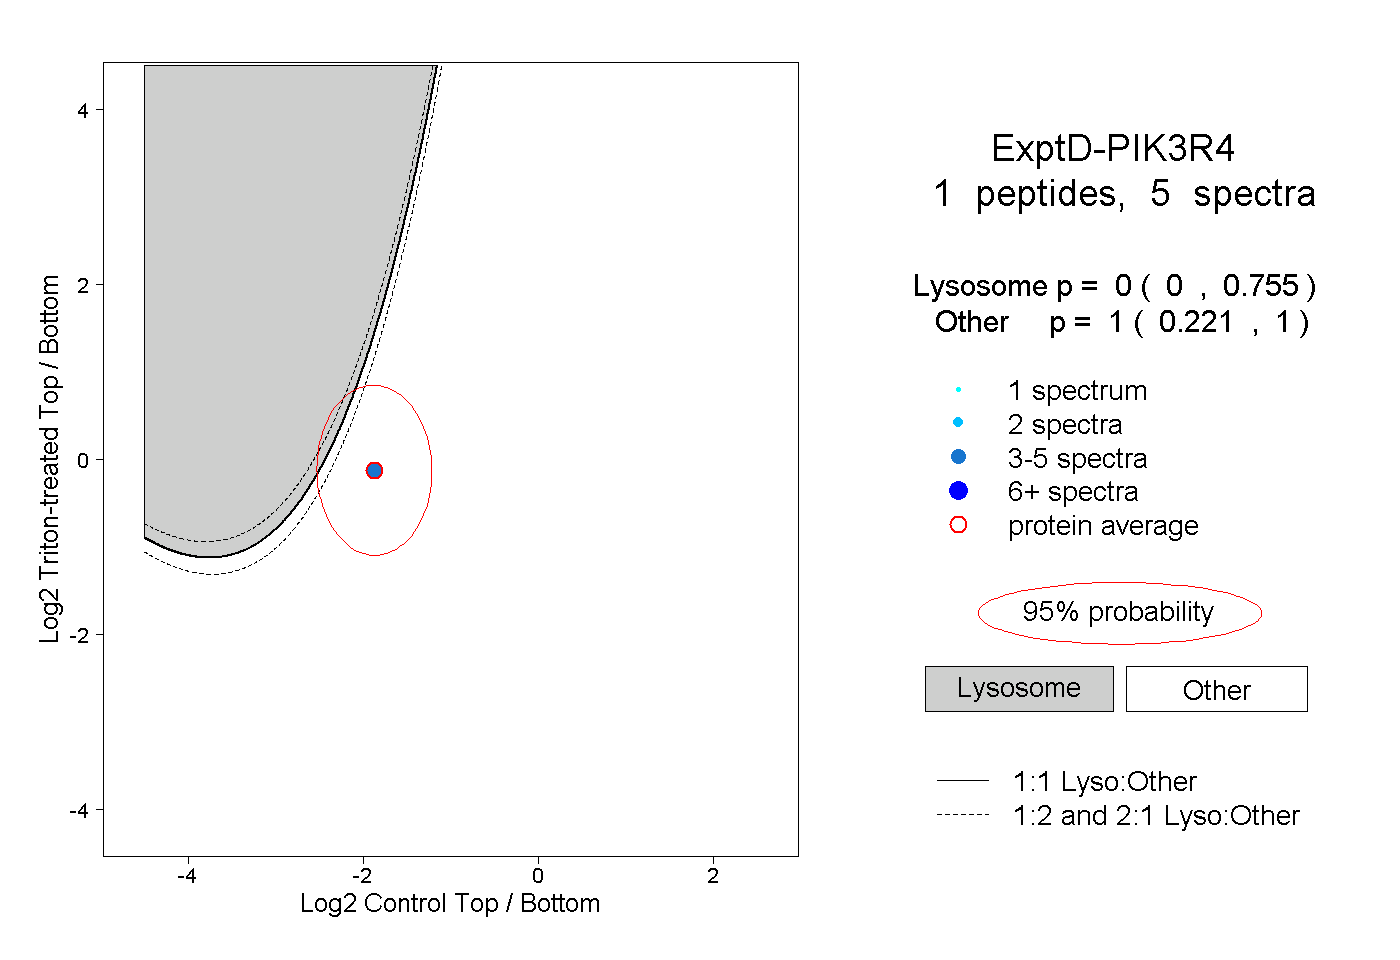 |
0.000 0.000 | 0.755 |
1.000 0.221 | 1.000 |