 86
86peptides
spectra
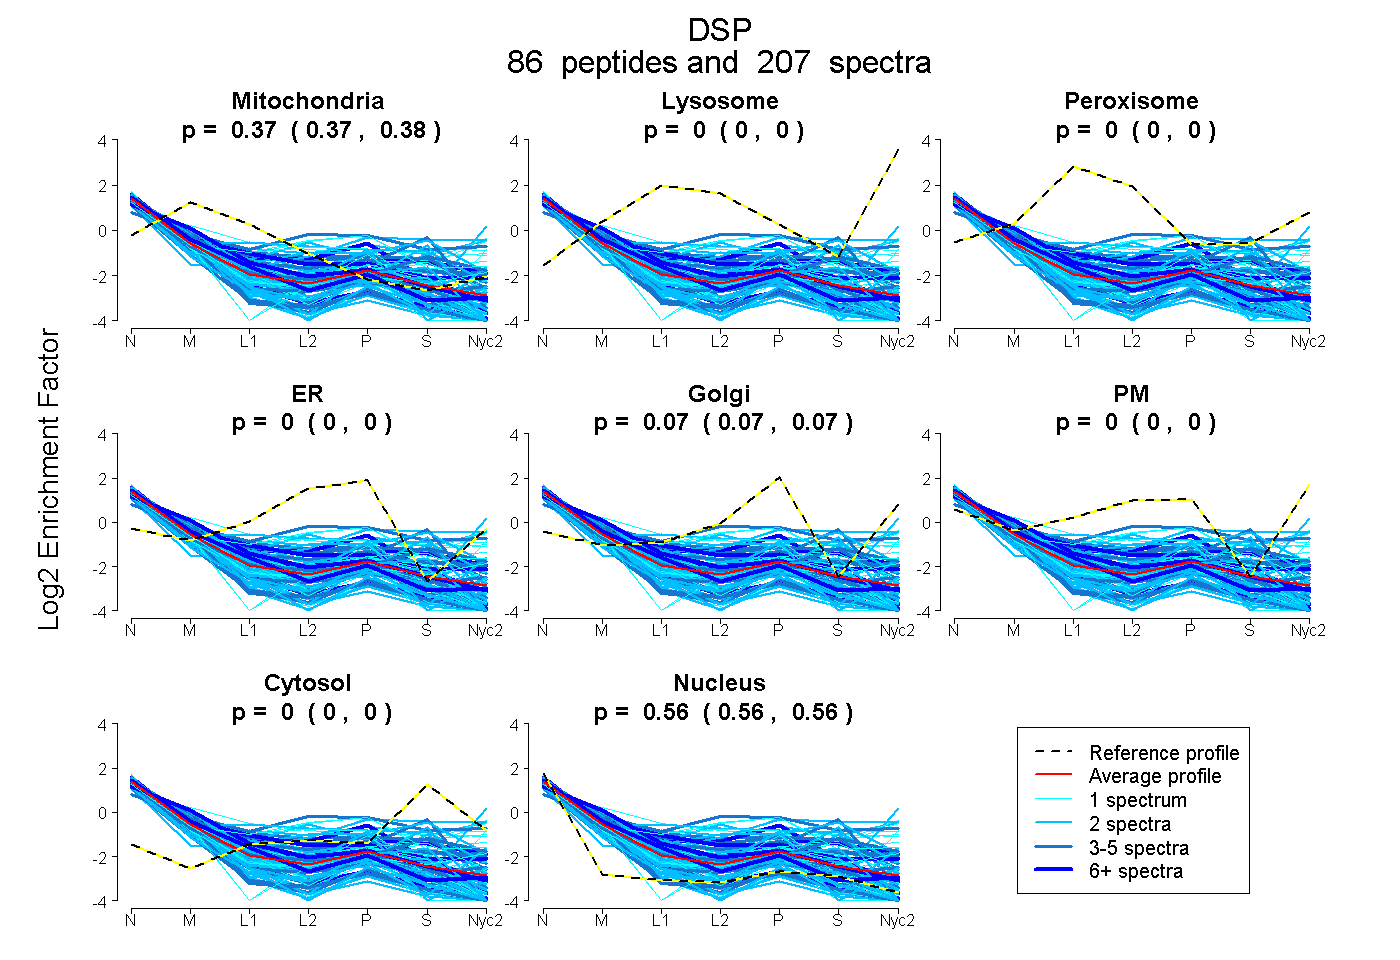
0.373 | 0.376
0.000 | 0.000
0.000 | 0.000
0.000 | 0.000
0.065 | 0.069
0.000 | 0.000
0.000 | 0.000
0.557 | 0.560
25peptides
spectra
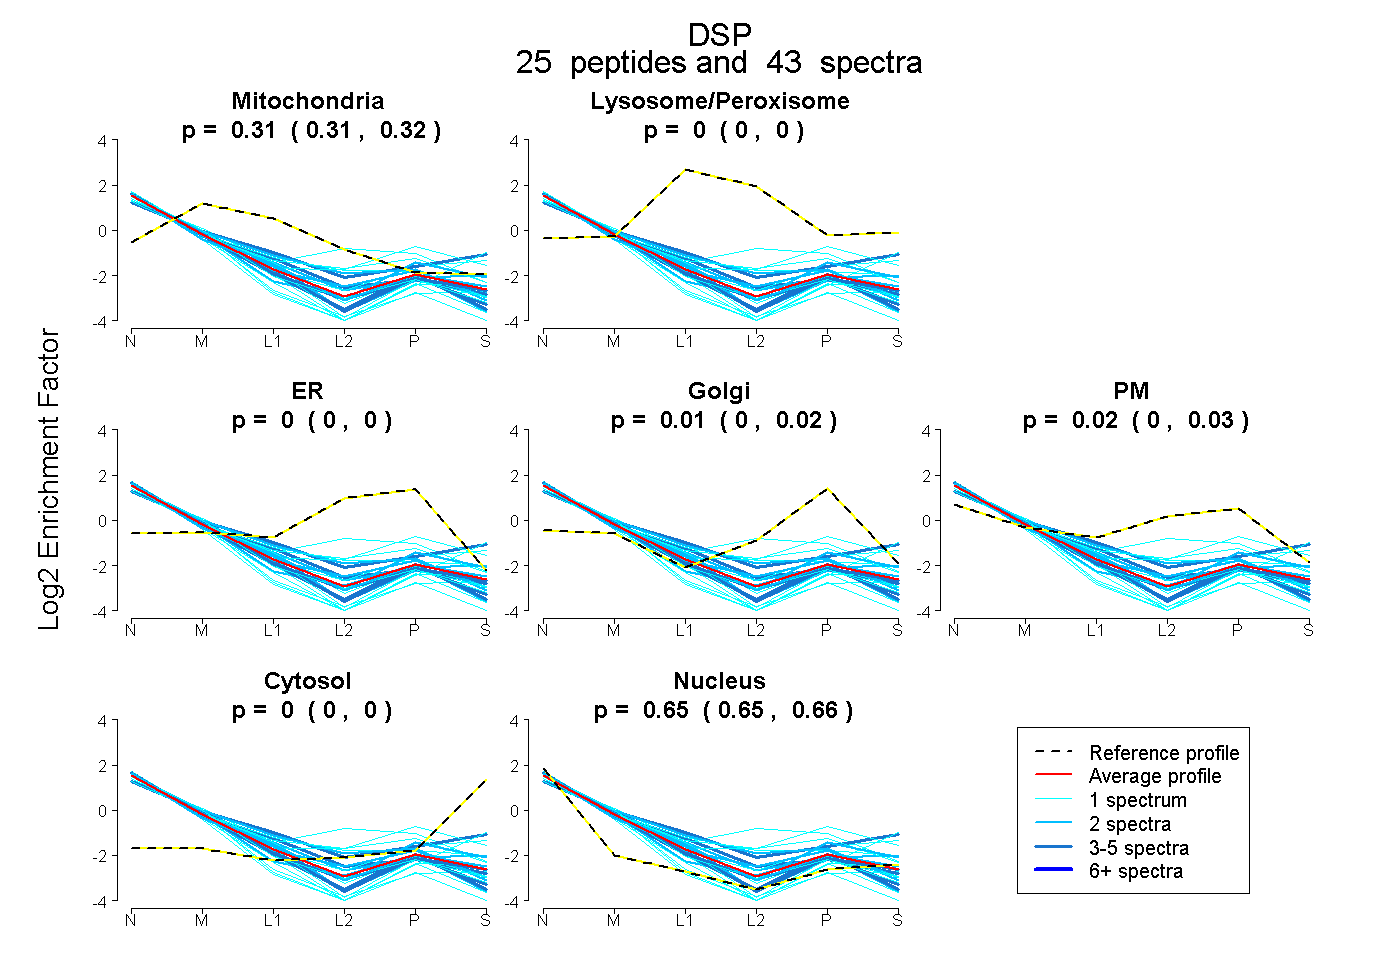
0.308 | 0.319
0.000 | 0.000
0.000 | 0.000
0.003 | 0.023
0.002 | 0.033
0.000 | 0.000
0.648 | 0.658
62peptides
spectra
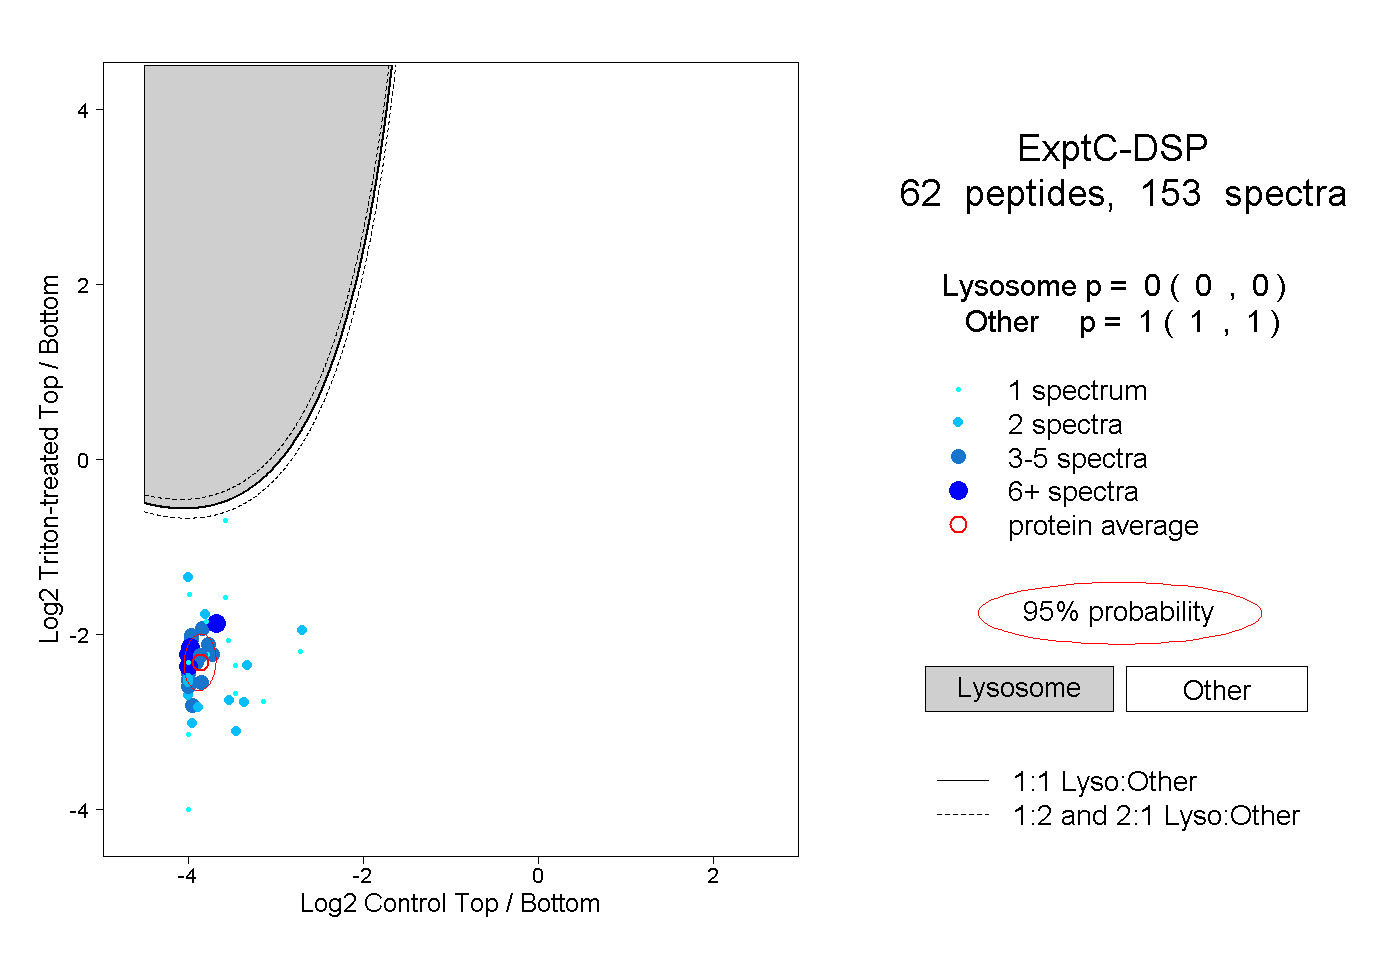
0.000 | 0.000
1.000 | 1.000
9peptides
spectra
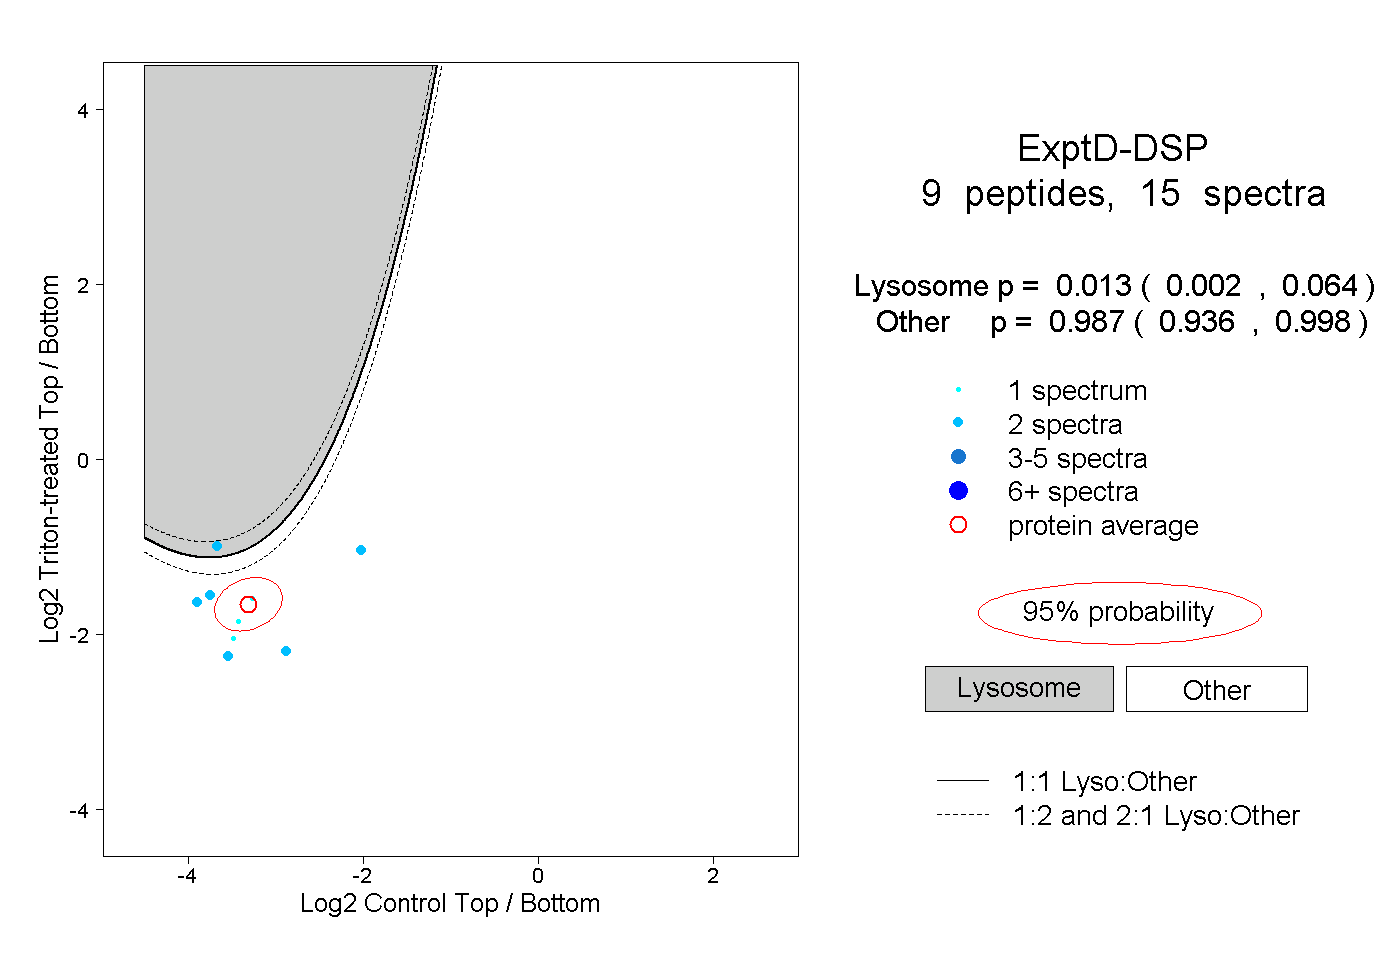
0.002 | 0.064
0.936 | 0.998