 10
10peptides
spectra
0.000 | 0.000
0.063 | 0.079
0.000 | 0.000
0.000 | 0.000
0.000 | 0.016
0.009 | 0.035
0.893 | 0.904
0.000 | 0.000
| Plot | Mito | Lyso | Perox | ER | Golgi | PM | Cytosol | Nucleus | |||||
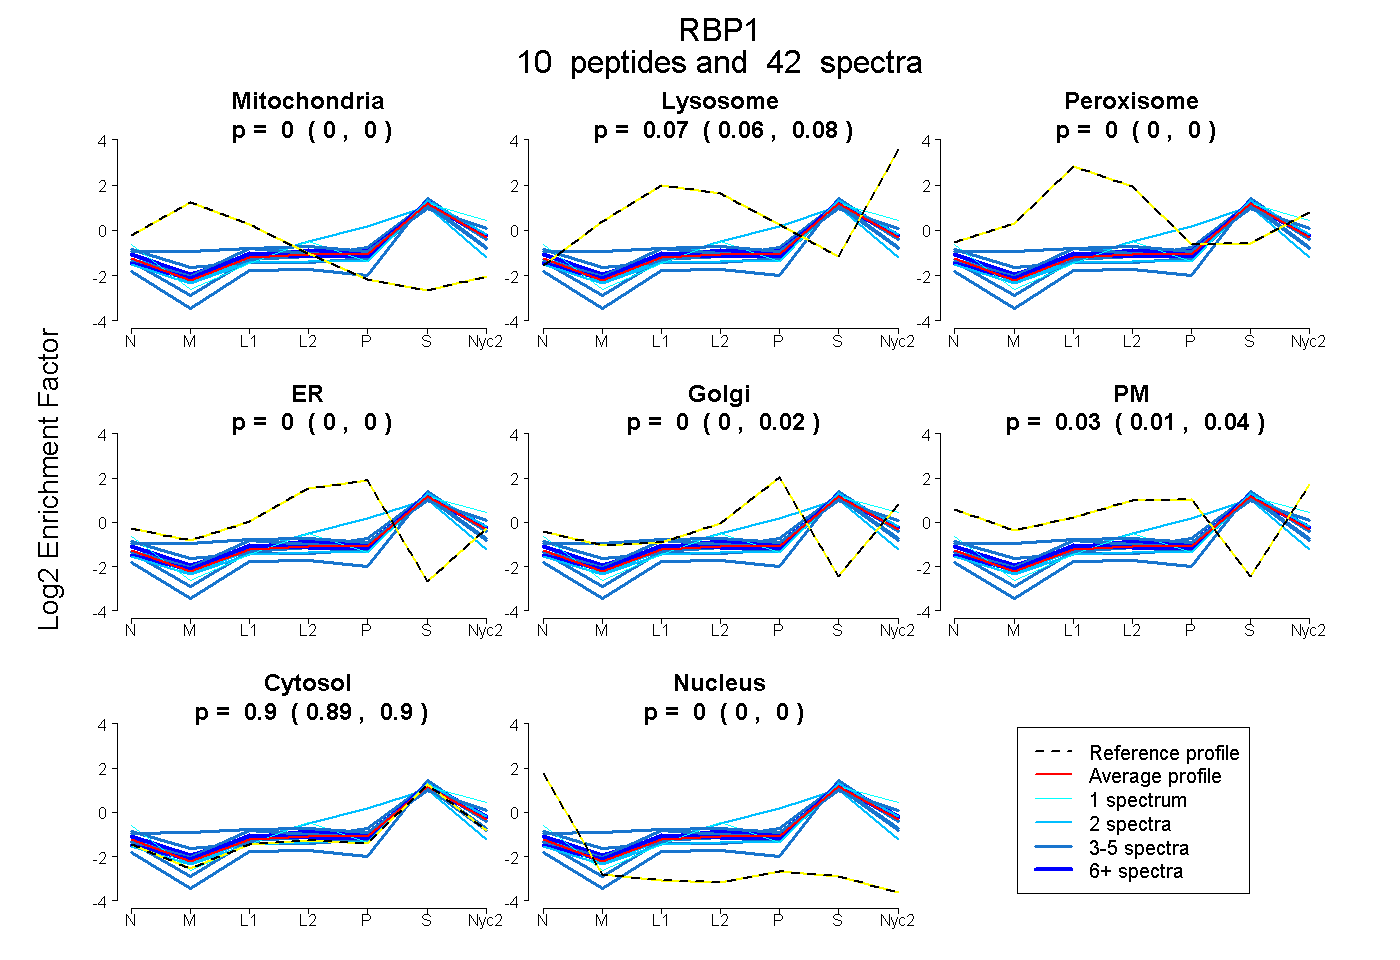
| Expt A |
10 peptides |
42 spectra |
|
0.000 0.000 | 0.000 |
0.071 0.063 | 0.079 |
0.000 0.000 | 0.000 |
0.000 0.000 | 0.000 |
0.000 0.000 | 0.016 |
0.029 0.009 | 0.035 |
0.900 0.893 | 0.904 |
0.000 0.000 | 0.000 |
| 3 spectra, ALDVNVALR | 0.000 | 0.007 | 0.000 | 0.000 | 0.075 | 0.000 | 0.918 | 0.000 | ||
| 3 spectra, GWTQWIEGDELHLEMR | 0.003 | 0.000 | 0.124 | 0.000 | 0.000 | 0.000 | 0.872 | 0.000 | ||
| 11 spectra, EIVQDGDHMIIR | 0.000 | 0.077 | 0.000 | 0.000 | 0.000 | 0.077 | 0.845 | 0.000 | ||
| 4 spectra, TLSTFR | 0.081 | 0.199 | 0.016 | 0.000 | 0.000 | 0.009 | 0.695 | 0.000 | ||
| 1 spectrum, PVDFNGYWK | 0.000 | 0.066 | 0.000 | 0.000 | 0.000 | 0.093 | 0.840 | 0.000 | ||
| 3 spectra, LQCVQK | 0.107 | 0.000 | 0.000 | 0.000 | 0.000 | 0.030 | 0.863 | 0.000 | ||
| 4 spectra, EFEEDLTGIDDR | 0.000 | 0.000 | 0.000 | 0.000 | 0.000 | 0.000 | 1.000 | 0.000 | ||
| 2 spectra, NYIMDFQVGK | 0.000 | 0.056 | 0.000 | 0.000 | 0.000 | 0.000 | 0.944 | 0.000 | ||
| 9 spectra, MLSNENFEEYLR | 0.000 | 0.108 | 0.000 | 0.000 | 0.000 | 0.000 | 0.892 | 0.000 | ||
| 2 spectra, AEGVTCK | 0.000 | 0.000 | 0.000 | 0.220 | 0.000 | 0.000 | 0.780 | 0.000 |
| Plot | Mito | Lyso or Perox | ER | Golgi | PM | Cytosol | Nucleus | ||||||
| Expt B |
4 peptides |
11 spectra |
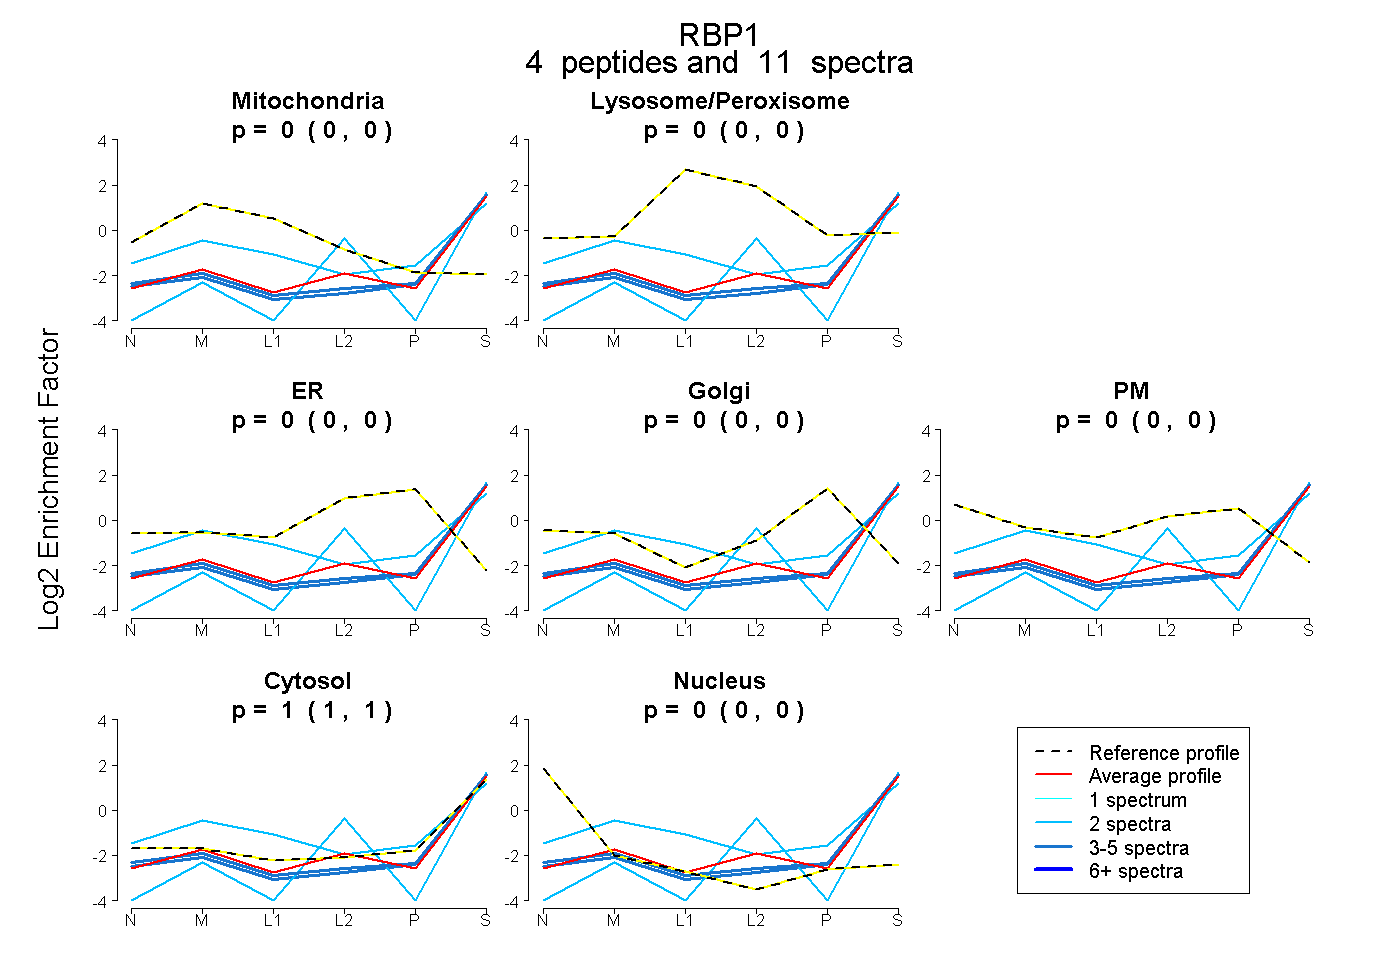 |
0.000 0.000 | 0.000 |
0.000 0.000 | 0.000 |
0.000 0.000 | 0.000 |
0.000 0.000 | 0.000 |
0.000 0.000 | 0.000 |
1.000 1.000 | 1.000 |
0.000 0.000 | 0.000 |
|||
| Plot | Lyso | Other | |||||||||||
| Expt C |
9 peptides |
74 spectra |
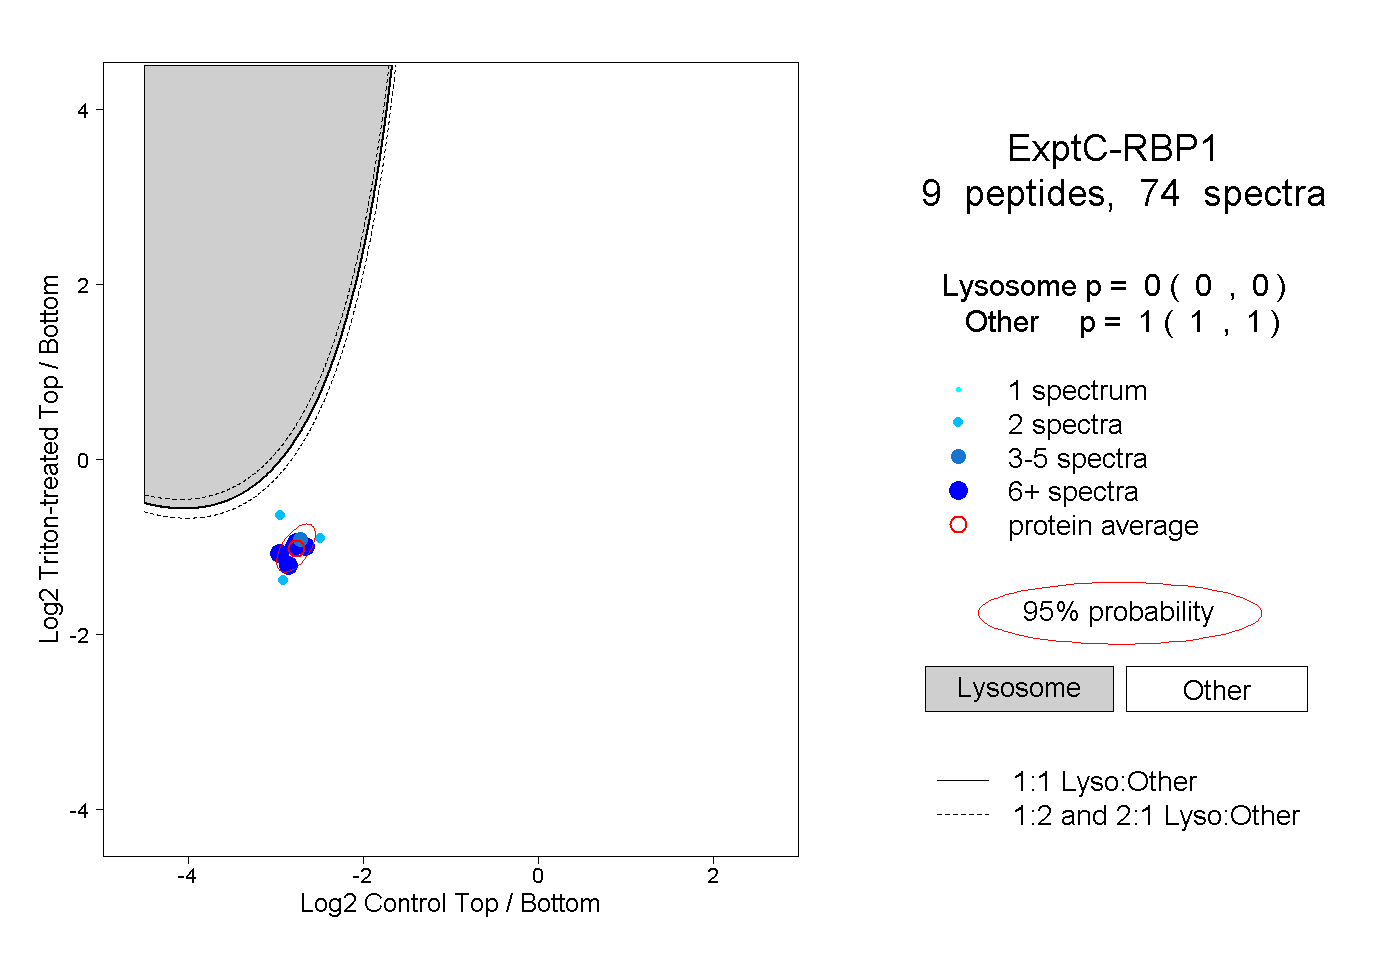 |
0.000 0.000 | 0.000 |
1.000 1.000 | 1.000 |