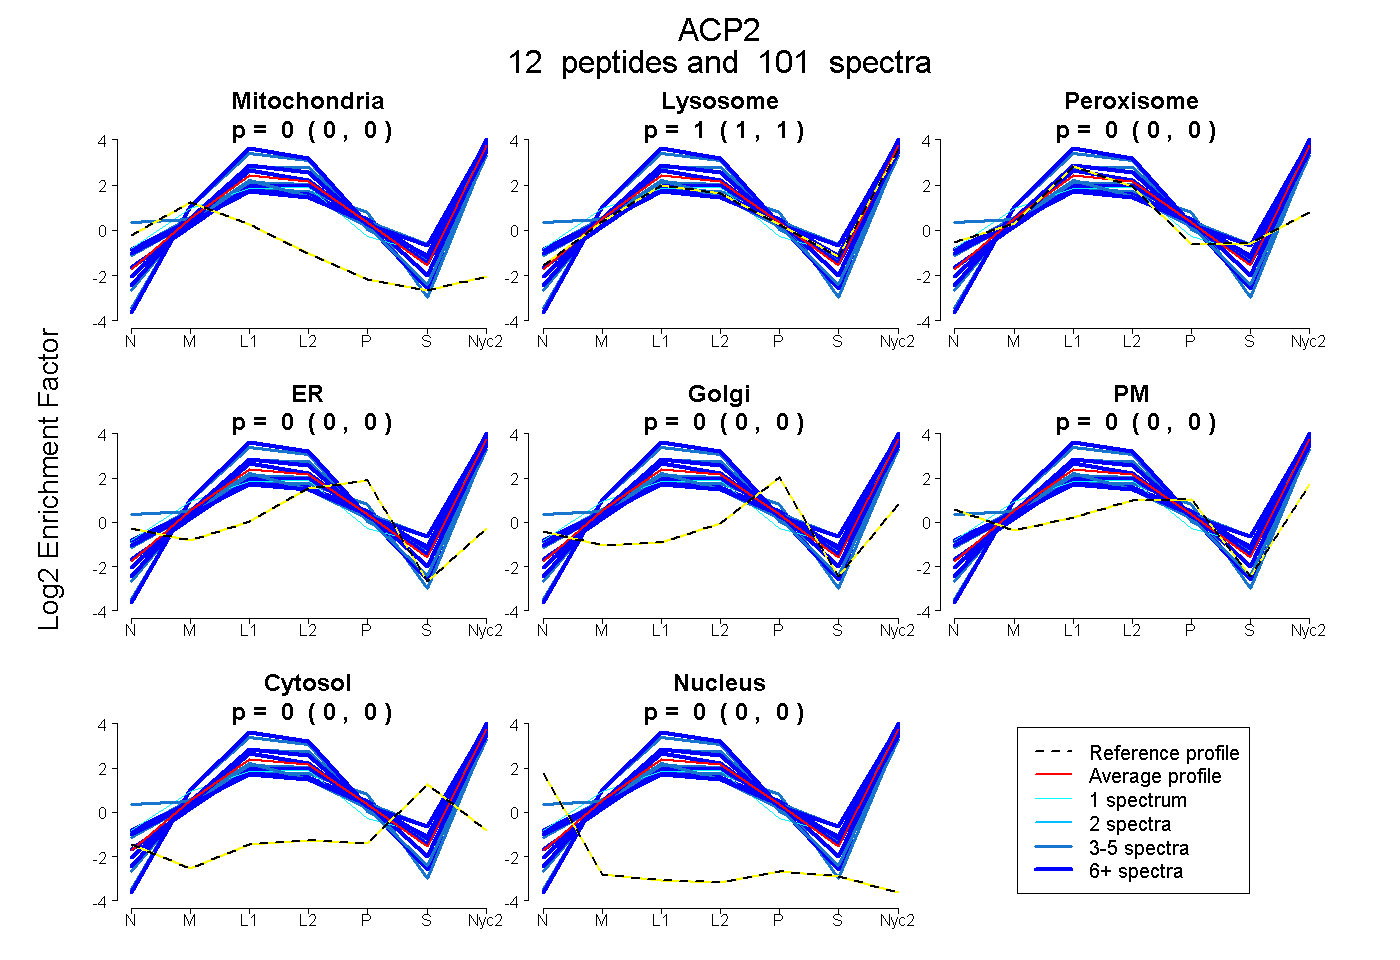
 12
12peptides
spectra
0.000 | 0.000
1.000 | 1.000
0.000 | 0.000
0.000 | 0.000
0.000 | 0.000
0.000 | 0.000
0.000 | 0.000
0.000 | 0.000
| Plot | Mito | Lyso | Perox | ER | Golgi | PM | Cytosol | Nucleus | |||||
| Expt A |
12 peptides |
101 spectra |
|
0.000 0.000 | 0.000 |
1.000 1.000 | 1.000 |
0.000 0.000 | 0.000 |
0.000 0.000 | 0.000 |
0.000 0.000 | 0.000 |
0.000 0.000 | 0.000 |
0.000 0.000 | 0.000 |
0.000 0.000 | 0.000 |
| 11 spectra, WPQGFGQLTK | 0.000 | 0.839 | 0.000 | 0.000 | 0.000 | 0.161 | 0.000 | 0.000 | ||
| 6 spectra, STDFDR | 0.000 | 1.000 | 0.000 | 0.000 | 0.000 | 0.000 | 0.000 | 0.000 | ||
| 3 spectra, DPYQEEK | 0.000 | 1.000 | 0.000 | 0.000 | 0.000 | 0.000 | 0.000 | 0.000 | ||
| 8 spectra, LQGGVLLAQILK | 0.000 | 0.941 | 0.000 | 0.059 | 0.000 | 0.000 | 0.000 | 0.000 | ||
| 19 spectra, QEVYVR | 0.000 | 1.000 | 0.000 | 0.000 | 0.000 | 0.000 | 0.000 | 0.000 | ||
| 5 spectra, APWPLTLPGCPHR | 0.000 | 0.690 | 0.000 | 0.000 | 0.000 | 0.310 | 0.000 | 0.000 | ||
| 1 spectrum, LTEPVIPK | 0.000 | 1.000 | 0.000 | 0.000 | 0.000 | 0.000 | 0.000 | 0.000 | ||
| 4 spectra, FVTLLYR | 0.000 | 0.922 | 0.078 | 0.000 | 0.000 | 0.000 | 0.000 | 0.000 | ||
| 22 spectra, EGMLQHWELGQALR | 0.000 | 0.875 | 0.000 | 0.000 | 0.000 | 0.125 | 0.000 | 0.000 | ||
| 3 spectra, MQAQPPGYHHVADR | 0.000 | 0.567 | 0.057 | 0.000 | 0.000 | 0.376 | 0.000 | 0.000 | ||
| 3 spectra, CPLQDFLR | 0.000 | 1.000 | 0.000 | 0.000 | 0.000 | 0.000 | 0.000 | 0.000 | ||
| 16 spectra, FPLGPCPR | 0.000 | 1.000 | 0.000 | 0.000 | 0.000 | 0.000 | 0.000 | 0.000 |
| Plot | Mito | Lyso or Perox | ER | Golgi | PM | Cytosol | Nucleus | ||||||
| Expt B |
11 peptides |
58 spectra |
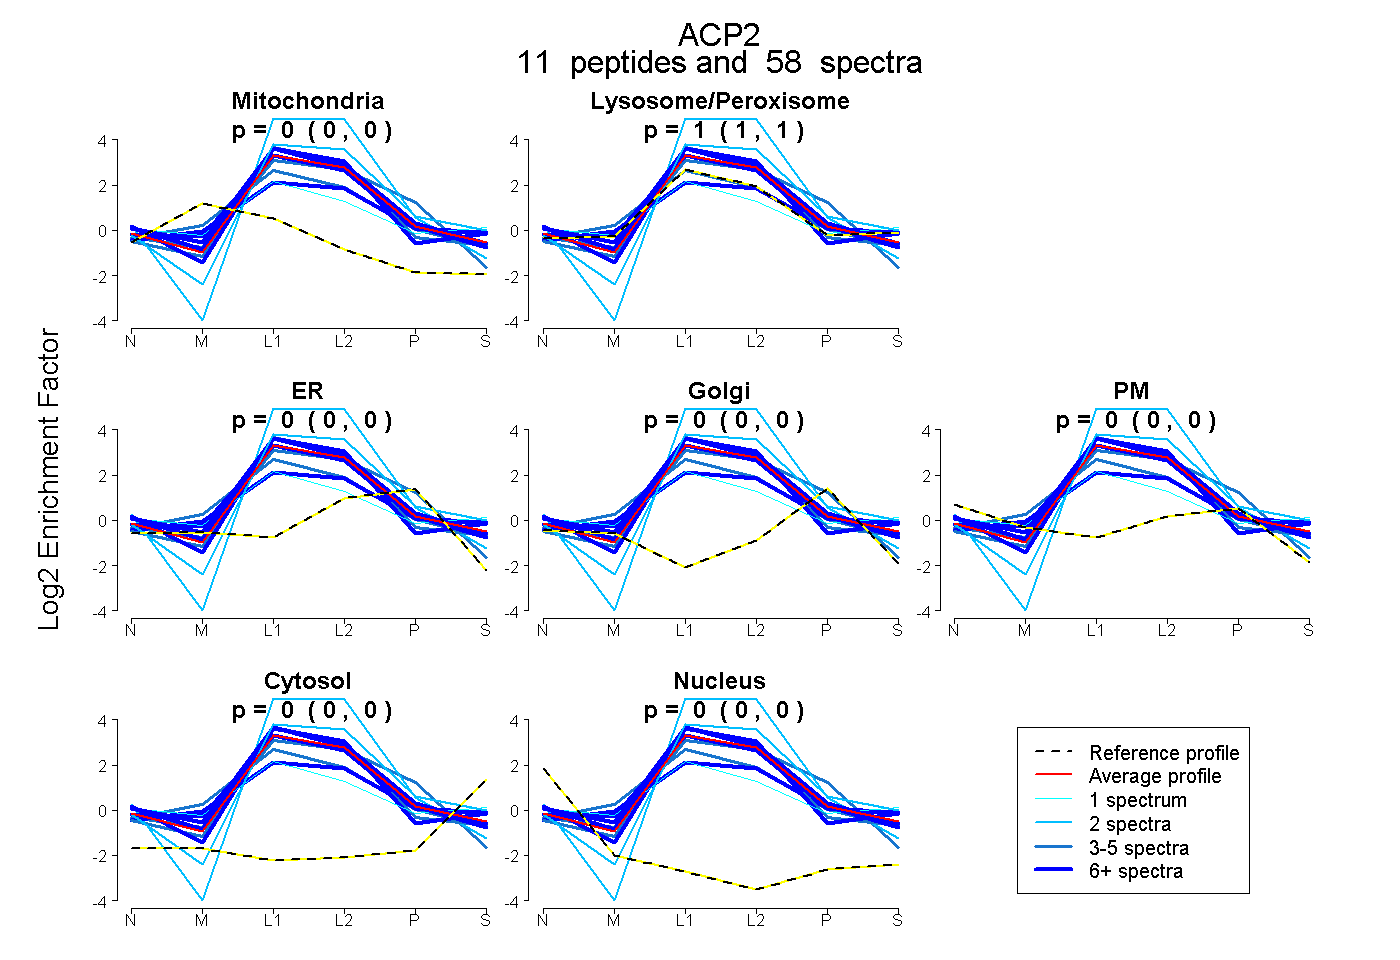 |
0.000 0.000 | 0.000 |
1.000 1.000 | 1.000 |
0.000 0.000 | 0.000 |
0.000 0.000 | 0.000 |
0.000 0.000 | 0.000 |
0.000 0.000 | 0.000 |
0.000 0.000 | 0.000 |
|||
| Plot | Lyso | Other | |||||||||||
| Expt C |
15 peptides |
621 spectra |
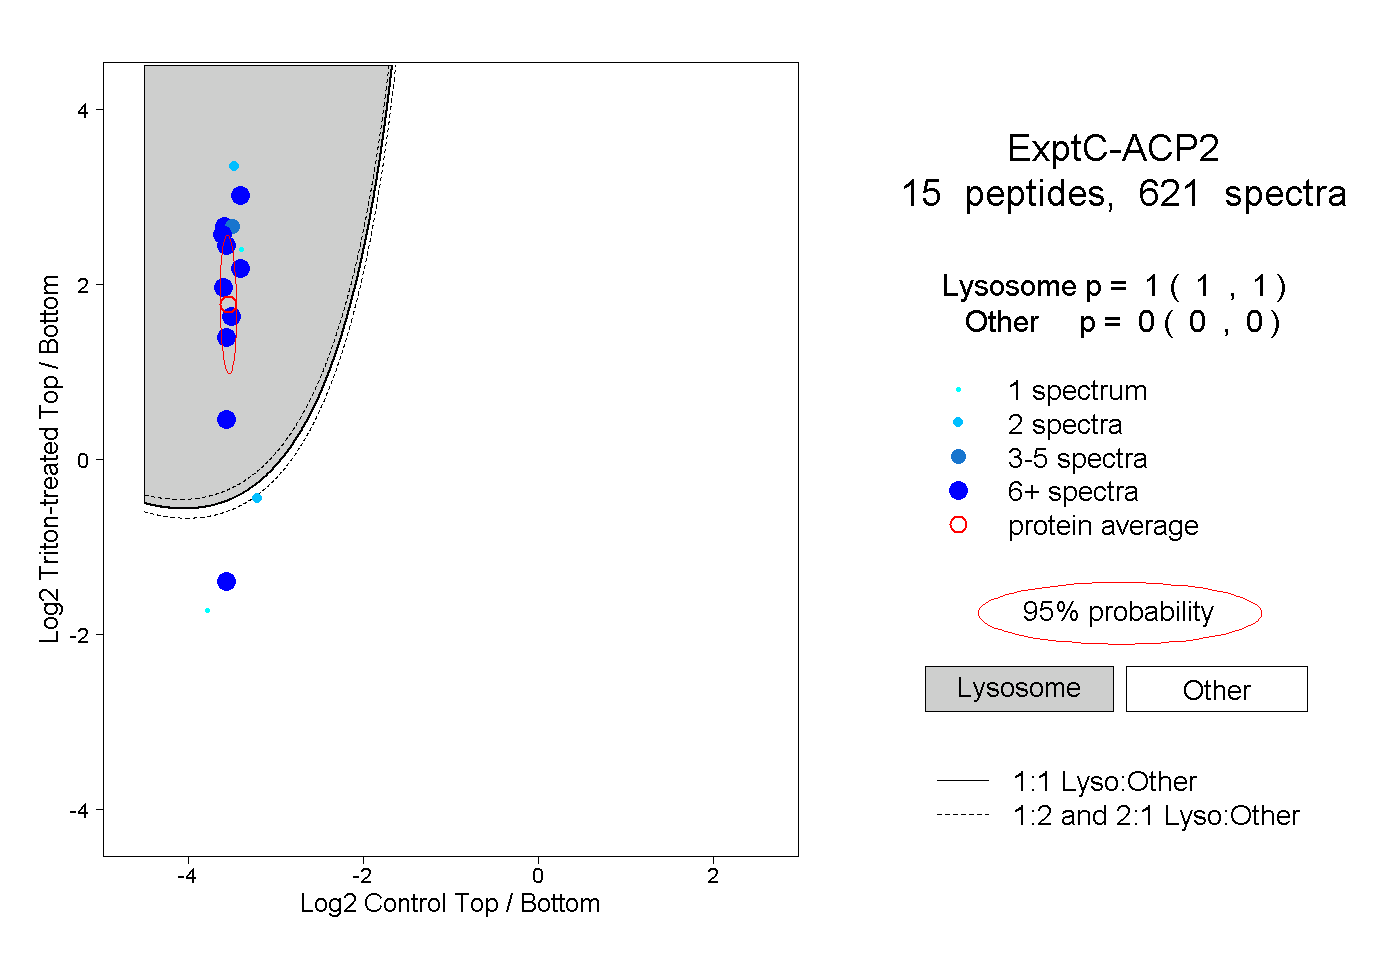 |
1.000 1.000 | 1.000 |
0.000 0.000 | 0.000 |
||||||||
| Plot | Lyso | Other | |||||||||||
| Expt D |
6 peptides |
18 spectra |
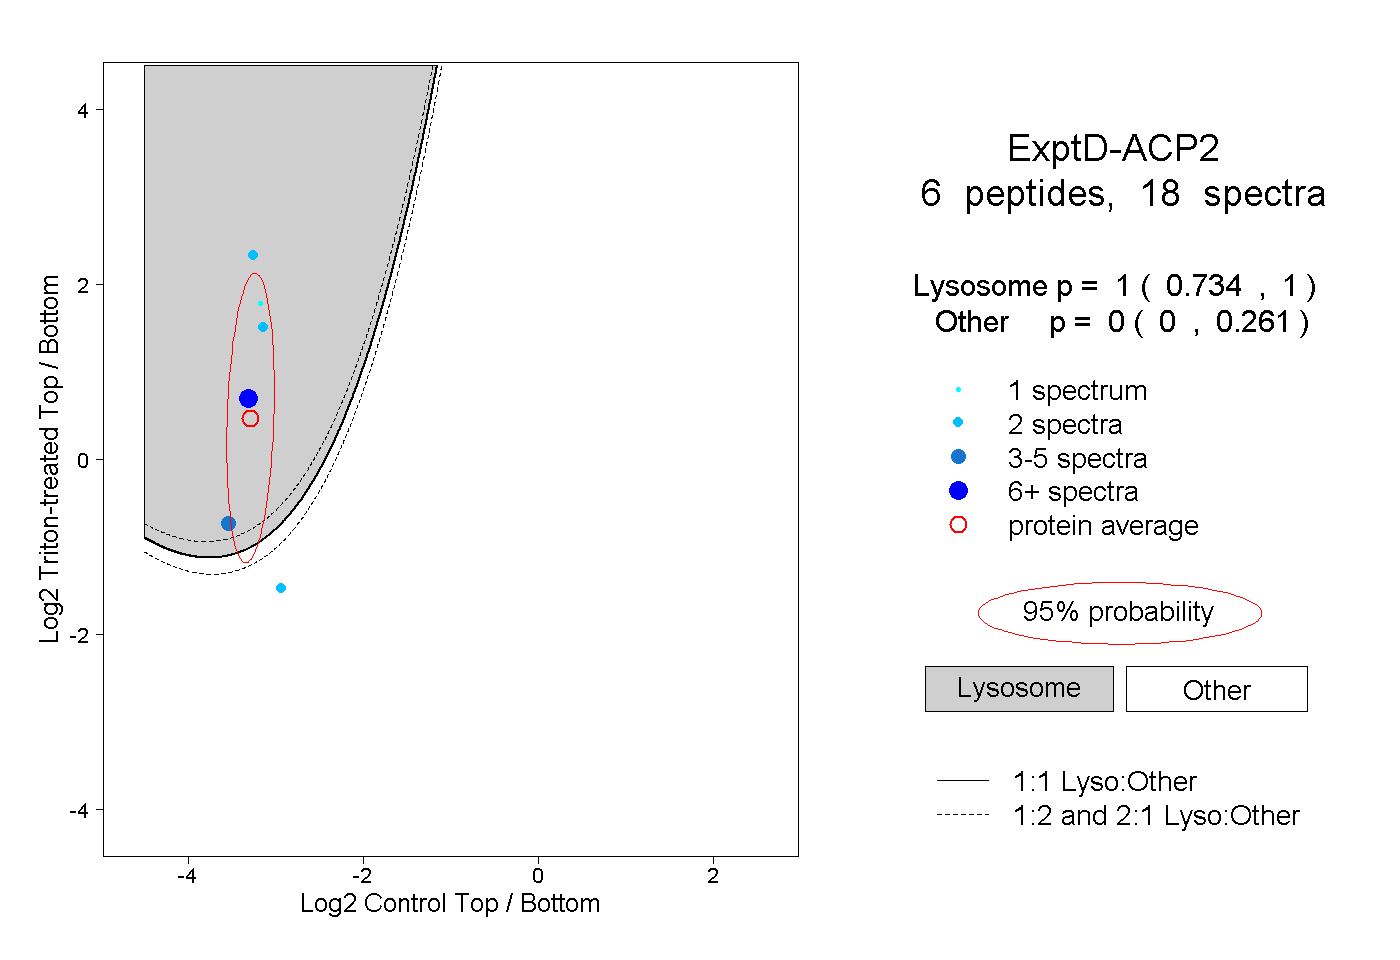 |
1.000 0.734 | 1.000 |
0.000 0.000 | 0.261 |