 2
2peptides
spectra
0.000 | 0.000
0.000 | 0.000
0.000 | 0.000
0.000 | 0.000
0.000 | 0.448
0.164 | 0.521
0.095 | 0.234
0.188 | 0.299
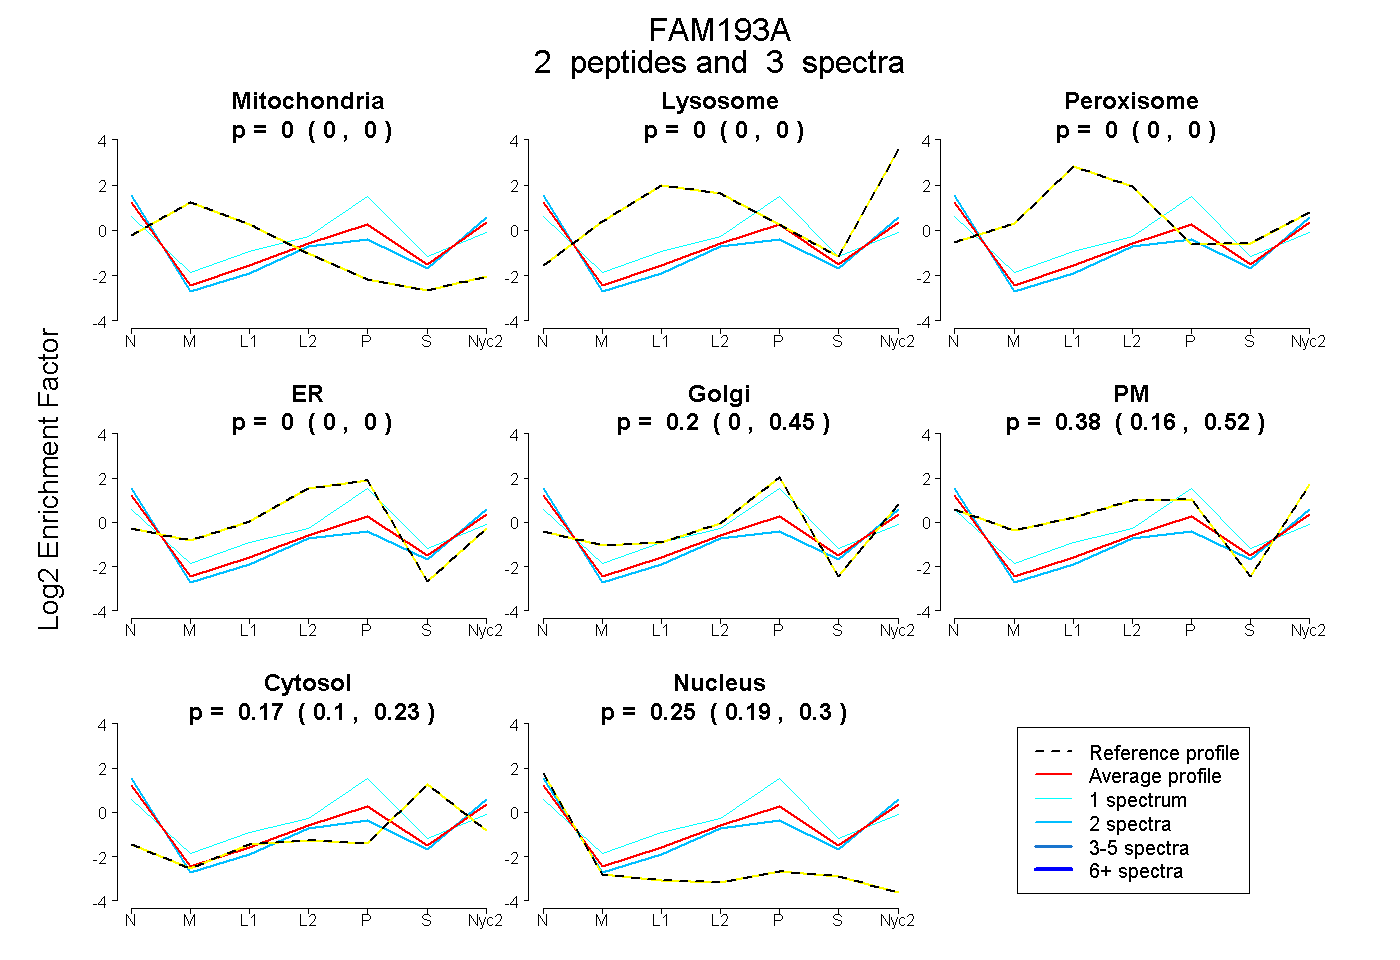
| Plot | Mito | Lyso | Perox | ER | Golgi | PM | Cytosol | Nucleus | |||||
| Expt A |
2 peptides |
3 spectra |
|
0.000 0.000 | 0.000 |
0.000 0.000 | 0.000 |
0.000 0.000 | 0.000 |
0.000 0.000 | 0.000 |
0.195 0.000 | 0.448 |
0.382 0.164 | 0.521 |
0.174 0.095 | 0.234 |
0.249 0.188 | 0.299 |
| 1 spectrum, EHLHHQEEQK | 0.000 | 0.000 | 0.000 | 0.143 | 0.523 | 0.054 | 0.195 | 0.085 | ||
| 2 spectra, LALSMAPK | 0.000 | 0.000 | 0.000 | 0.000 | 0.000 | 0.507 | 0.164 | 0.329 |